Robust Mix Proportioning of Self-Compacting Concrete Mixes - A Comparative Study
Dr. Sri Kalyana Rama Jyosyula, Associate Professor (Department of Civil Engineering), R&D Coordinator (Institute), Vignana Bharathi Institute of Technology (Autonomous), Hyderabad 501301, India
Concrete being the second largest consumed material after water needs attention towards sustainable construction with an increase in infrastructure. The world is moving towards innovative techniques and methodologies for sustainable and durable construction of concrete structures. The selection of suitable ingredients for making concrete and determining the relative amounts with an objective of producing a concrete of required strength and durability is the need of the hour. Standard mix proportioning of concrete should satisfy the workability requirements and also meet the requirement for mechanical properties, durability, economy, and even ecology of engineering applications. The study would focus on quality control aspects in mix proportioning the concrete as per the requirements of the industry. It includes mix proportioning of self-compacting concrete as per the standards prescribed in national construction community and Indian standards, plastic viscosity, and EFNARC based mix proportioning of self-compacting concrete. The mix proportioning would focus on utilizing various industrial and agro wastes as a suitable cement replacement material, locally available fine and coarse aggregate materials along with their alternates, appropriate dosage of admixtures, etc. The outcomes of the study include the formulation of handouts and readymade mix proportions of self-compacting concrete used in the construction of buildings and pavements along with their cost estimation. The study also provides information on some of the key points to be considered in making concrete using optimization concepts which would further reduce the cost of construction. The optimized mix proportions will be handy for the ready-mix plants especially in dealing with multiple large-scale construction activities. Mix proportioning using plastic viscosity approach was proven to be economical compared to other mix design methods.
Introduction
Durability was one of the major topics of interests during the early eighties of the last century in Japan. Strength and durability of concrete at its hardened state depends on the quality of concrete and quantity of vibration. Skilled workers are required to make the concrete mixes more compactable. Japan faced the scarcity of skilled labor during the early eighties, which resulted in poor quality of construction. This led to the development of Self-compacting concrete which was first coined in mid-eighties in Japan (Okamura and Ouchi, 2003). Underwater placement of concrete is also one of the primary reasons for the outcome of SCC (Gaimster and Dixon, 2003). Concrete which has the ability to flow and consolidate under its own weight is defined as Self-Compacting concrete as per European guidelines (EFNARC 2005). It is also defines as a special type of concrete which provides good filling ability, passing ability and segregation resistance (Khayat et al, 1999). The first SCC mix was proposed by Okamura in 1986 in Japan at Tokyo University. SCC was mainly introduced to reduce the noise during vibration and make the mix more reachable to congested formwork. In the end of 1990’s the concept of SCC was spread to European countries (Billberg, 1999). Sweden used about 20% to 30% of SCC as an annual production of the overall concrete production in ready-mix and precast industries (Thrane et al., 2004). Later UK, France and Germany also started developing and using SCC in their construction industry (Ouchi et al., 2003). Some of the famous structures where SCC was used in construction are a) Anchorages of Akashi-Kaikyo suspension bridge, Japan b) Pumping of SCC for 166 stories above the ground of Burj Khalifa, Dubai c) Sodra Lanken project, Stockholm d) 74 storied tallest Yokahoma Landmark tower in Japan e) La Maladiere Football Stadium, which was made up of 60000 cum of SCC. SCC was used successfully in many of the bridge and tunneling projects of European countries (Ouchi et al. 2003).
In the recent past United States also started using SCC in the name of Self-consolidating Concrete especially in precast industries. Industry Critical Technology Committee on Self-Consolidating Concrete wanted all the ready mix concrete plants to adopt 15% of SCC by 2015 (ICT-SCC 2011).
In India SCC has been widely used since 1990’s. It is used mainly in the construction of bridges, buildings and tunnel construction. With the increasing use of Ready Mix Concrete (RMC) in India, use of SCC is also increasing. RMC used in 2012 was to the tune of 11 million cubic metre which is expected to increase 300% by 2022. Mumbai-Pune expressway, Mumbai sewage disposal project, J.J. Flyover, Bangalore International Airport, Vivekanada Bridge, Kolkota, Bandra-Worli bridge and Delhi Metro (Fig. 2.8, 2.9, 2.10 & 2.11) are few projects where SCC has been used successfully. (Kumar and Kaushik 2003). It is also expected that there will be an increased production of SCC considering the need for large scale construction.
Mix design of SCC with various supplementary cementitious materials
The technical advantages of SCC mainly comprised of the benefits like concreting in heavily reinforced sections, with the help of SCC, thin section precast units could be manufactured and also structures of any geometry could casted. Economically too, SCC was preferred due to its reduced construction time and reduced labour costs because of safe operations. Because SCC had a reduced level of carbon foot-printing and had a large scope for use of waste materials, it had environmental advantages as well.
The mix compositions for conventional concrete and Self compacting concrete are almost similar. Coarse aggregate content in SCC mixes are less compared to conventional concrete and fines are in larger content. A typical mix composition of SCC and conventional concrete is shown in Figure 1.
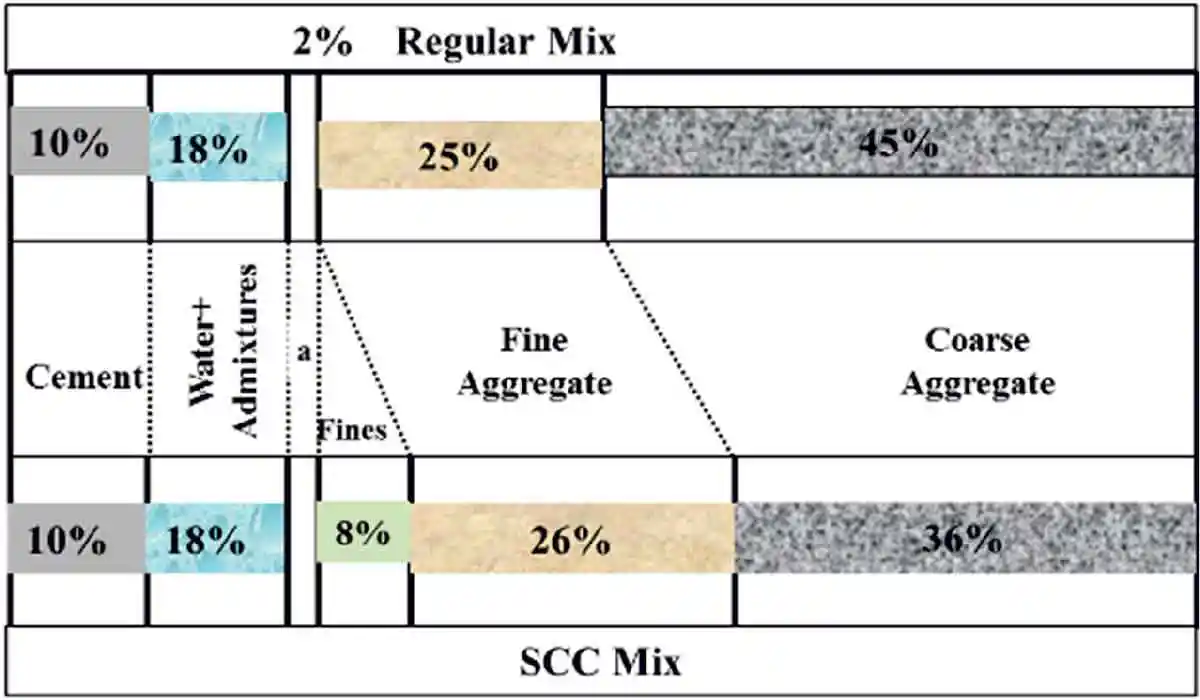 Figure 1: Conventional concrete vs SCC mix
Based on several researcher’s contribution the mix design of SCC is classified into 3 main categories (Domone et al., 1999).
- Powder method – Achieved by adding more powder content and by increasing fines. Supplementary Cementitious materials are also added to improve the viscosity of the mix.
- Viscosity Modifying Agent (VMA) method – Use of suitable VMAs as well as High Range Water Reducing admixtures to enhance the segregation resistance.
- Combination method – Balanced use of powder and viscosity agents based on the availability of materials, requirements of construction and limitation of concrete plants.
Mix Proportioning of Self Compacting Concrete
There are various methods to proportion Self Compacting Concrete as shown in Figure 2.
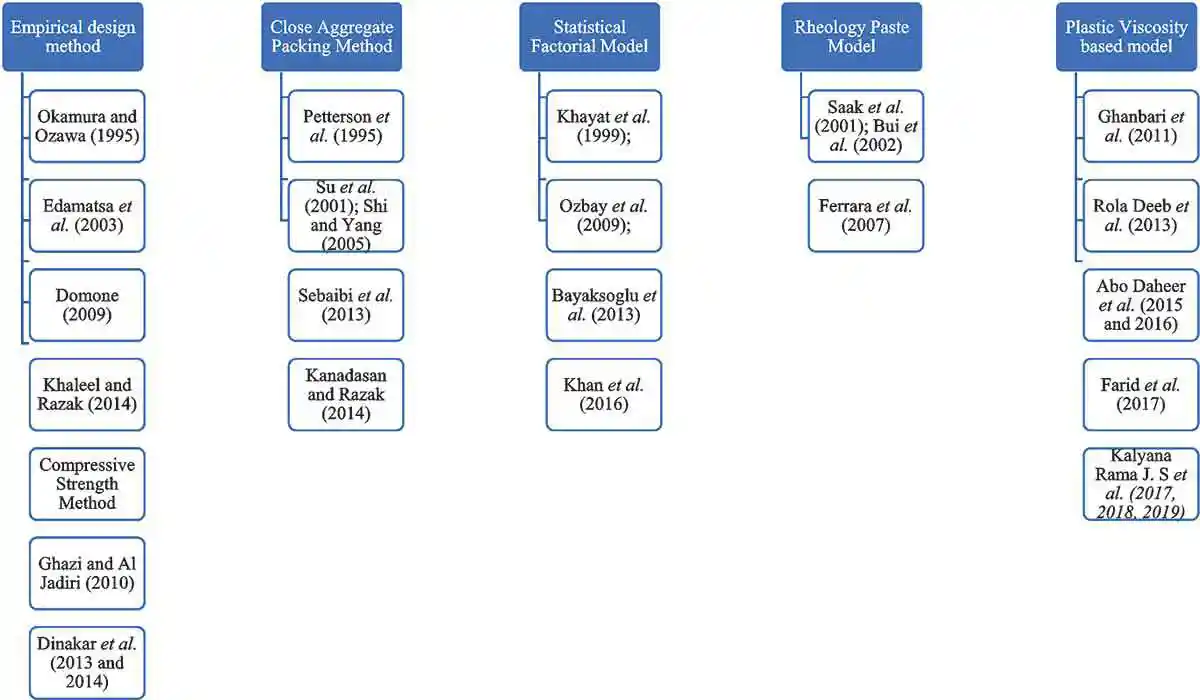 Figure 2: Various Methods to proportion Self Compacting Concrete
Mix proportioning using IS 10262:2019
Bureau of Indian Standards had introduced mix proportioning of SCC mixes in the revised version of IS 10262:2019. The following is the step by step process of proportioning SCC mixes.
- Target strength for mix proportioning
- Choose an approximate Air content
- Selection of an appropriate water to cement ratio
- Selection of water content and cementitious content
- Selection of admixture content
- Selection of Powder Content and Fine Aggregate Content
- Selection of Coarse Aggregate Content
- Calculation of Volume of Powder Content
Plastic Viscosity based Mix proportioning
To describe the flow behavior of concrete, a rheological parameter plastic viscosity is much better than workability which is calculated by conducting slump flow test, compaction factor tests etc. Rheological studies can be carried out using Brookfield Viscometer to measure the yield stress and most importantly plastic viscosity of cement paste with different compositions. Following procedure is followed for proportioning SCC mixes based on the plastic viscosity of the paste.
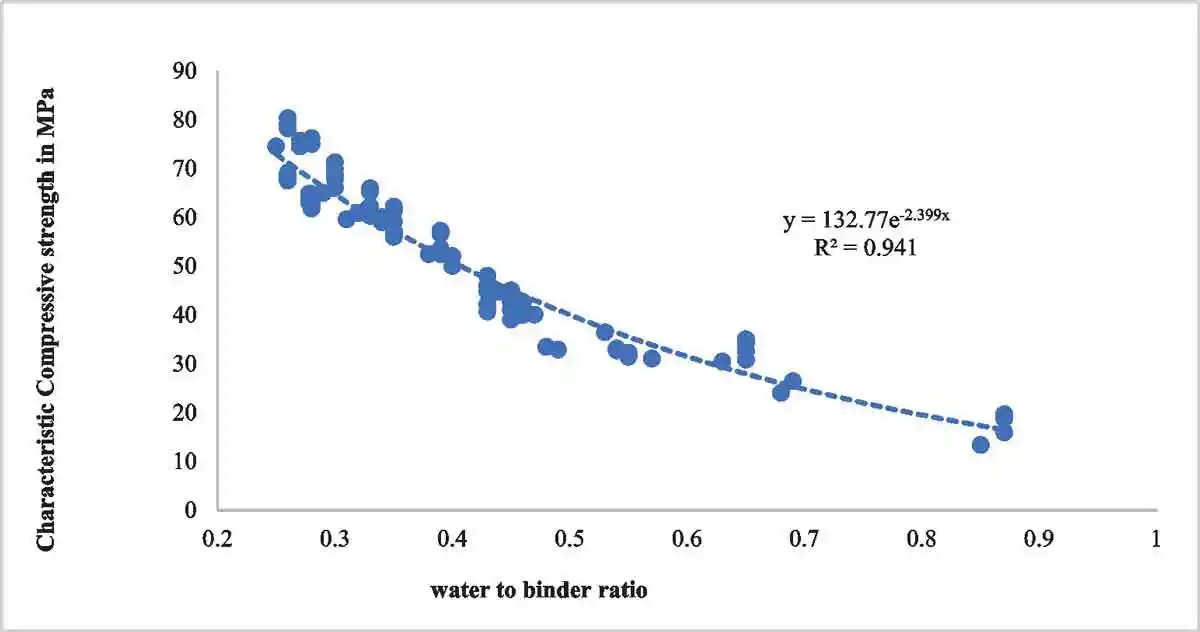
According to Abram’s law of water to cement ratio, the compressive strength of concrete depends on the water-cement ratio adopted and the strength is inversely proportional to water to cement ratio (in terms of mass). Based on this law it is clear that the strength of SCC also depends on the water to binder ratio. In order to establish a relation between the strength of concrete and the water to cement ratio, a set of values for water to cement ratio and the resulting 28 day-compressive strength using various mineral admixtures are adopted from (Boukendakdji et al., 2012; Douma et al., 2016, 2014; Uysal et al., 2012; Uysal and Tanyildizi, 2012; Uysal and Sumer, 2011; Gesoglu et al., 2009; Siddique et al., 2011; Alqadi et al., 2013; Raheman and Modani, 2013; Aggarwal and Aggarwal, 2011; Pathak et al., 2012; Guneyisi et al., 2010; Beycioğlu et al., 2014) Using this data, regression analysis is performed to obtain the best fit curve as shown in which is Abram’s type power curve with R2 = 0.941. The expression for compressive strength in terms of w/b ratio is given by

Where,
fcu is the 28-day cube compressive strength of concrete in MPa.
w/cm represents the adopted water to cement ratio of the concrete mixture.
SCC mix is considered as a suspension of particles in which the rigid solid spheres (aggregates) are suspended in a viscous fluid (cement paste). Firstly, to the suspension of cement paste, fine aggregate is added and then to this mixture coarse aggregate is added and then the process continues. Now, following this procedure, a standard expression is developed as

Where,
ηpaste represents the plastic viscosity of cement paste.
ϕ1, ϕ2.........ϕn, are the volume fractions of the particles (phases) to be added to the suspension of cement paste.
Applying the Krieger and Dougherty theory to calculate the contribution of individual particle to the plastic viscosity of the mix is given as

From the Eq.s (2, 3), the plastic viscosity of the SCC mix is given as

By adding fine aggregate to the suspension of cement paste, first the packing fraction of the suspension or the mixture is assumed to be random hexagonal packing and then after the addition of coarse aggregate the packing becomes dense and then the packing is assumed to be hexagonal packing. Based on these assumptions, the plastic viscosity of SCC mix is given as

Specific gravities of materials used for proportioning the materials required for SCC mix is given in Table 1
| Table 1: Specific Gravity of raw materials | |
| Raw Material | Specific Gravity |
| OPC | 3.15 |
| Fly Ash | 2.16 |
| GGBS | 2.85 |
| Rice Husk Ash | 2.1 |
| Crushed Sand | 2.61 |
| Coarse Aggregate | 2.71 |
| Superplasticizer | 1.07 |
Another input required for the proposed mix design methodology is the plastic viscosity of the cement paste. So, for the given grade of SCC to be proportioned, the water to cement ratio adopted is 0.5 as per Eq. 1. Corresponding to 0.5 water to cement ratio, the plastic viscosity of cement pastes for different cementitious materials are measured using Brookfield viscometer. The plastic viscosities of pastes with different cementitious materials are given in Table 2.
| Table 2: Plastic Viscosity of cementitious pastes | |
| Cementitious material combinations | Paste plastic viscosity (Pa-s) |
| 100 % - OPC | 0.24 |
| 75 % - OPC + 25 % - GGBS | 0.25 |
| 80 % - OPC + 20 % - Fly ash | 0.22 |
| 50 % - OPC + 25 % - GGBS + 25 % - Fly ash | 0.26 |
Based on these plastic viscosities and considering the target plastic viscosity of the SCC to be proportioned as 7, 9 and 11 Pa-s for water to binder ratio of 0.57 and 9 and 13 for water to binder ratio of 0.5. The proportions of different materials used to prepare an SCC mix with a grade equal to M 40 are calculated with the help of a computer program. Different values of parameters t1 & t2 are considered as an input starting from 0 to the maximum value with a condition that the volume fractions of coarse and fine aggregates do not exceed 1. The output of this code generated several combinations of SCC mix proportions and some of the best mixes from many combinations generated are chosen based on the satisfactory requirements of EFNARC guidelines.
Case I: Influence of plastic viscosities 9 Pa s and 13 Pa s on the fresh and hardened properties for water to binder ratio of 0.5.
The following is the step-by-step process for proportioning the SCC mixes:
- The first step is to choose a corresponding grade of concrete and accordingly water to cement ratio is calculated from Eq. 1.
- Plastic viscosity of the paste is to be adopted based on the water to cement ratio obtained from step (1). The values of plastic viscosity of the paste are obtained either by measuring using Brookfield Viscometer or from standard literature available. For the current study, these values are obtained using Brookfield Viscometer.
- Based on the required workability of the mix, a trial plastic viscosity of the mix has to be chosen. With the increase in plastic viscosity of the mix, T50 time increases accordingly. With the addition of fibres, the plastic viscosity of the mix will be on the higher side.
- Adopt suitable water content as per the standard EFNARC guidelines ranging from 150 to 210 kg/m3 based on the overall workability of the mix.
- With the known water to cement ratio and water content, total cementitious content is to be calculated. Total cementitious content is a combination of OPC, fly ash and GGBS depending on the type of additions i.e. binary or ternary.
- The % replacement of OPC with GGBS and Fly ash with OPC for binary blends is suggested as 25 % for GGBS and 20 % for Fly ash for good strength gain properties by ACC limited. By consulting the industry experts, a replacement of 25% of GGBS and 25% of Fly ash is suggested for ternary mixes (Abhijeet et al).
- A trial super-plasticizer dosage as a % of the cementitious material is adopted which satisfies the required workability of the SCC mix.
- Individual quantities of ingredients i.e. amount of coarse and fine aggregate to be added can be found from the volume fractions of materials obtained from Eq. (6 and 7). t1 and t2 are arbitrarily chosen such that t1 x t2 = 1. Each of them corresponding to the factor representing the volume fraction of fine and coarse aggregate.
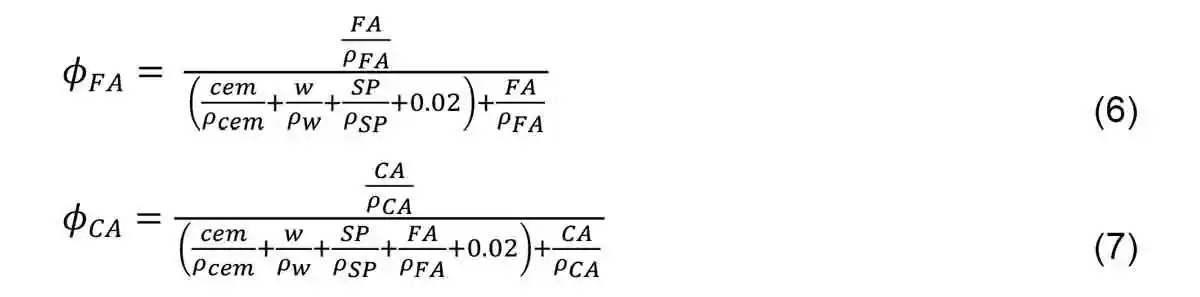
- Where,
- Cem = Cementitious material
- FA = Fine Aggregate
- CA = Coarse Aggregate
- SP = Superplasticizer
- w = Water
- η
- = Plastic Viscosity of the Mix
- η
- = Plastic Viscosity of the Paste
- η
- = Plastic Viscosity of the Suspension of Particles
- ρ
- = Density of Coarse Aggregate
- ρ
- = Density of Cement
- ρ
- = Density of Fine Aggregate
- ρ
- = Density of Superplasticizer
- ρ
- = Density of Water
- ϕ
- , ϕ
- = Volume Fraction of Coarse Aggregate and Fine Aggregate
- The total volume of the mix should be equal to 1 m3. Suitable adjustments have to be made to ensure that the total volume equals 1 m3.
- Eq. (5) is being used to estimate the plastic viscosity of the mix with the obtained proportions of raw materials. The percentage difference between the assumed plastic viscosity from step (3) and the estimated plastic viscosity should be within 5%. If the difference is more, then different sets of volume fractions for solid phase ingredients i.e. fine and coarse aggregates are to be chosen and steps 9 and 10 are to be repeated.
The proportions for different combinations of SCC mixes for a chosen M40 grade designed as per IS 10262:2019 and plastic viscosity are shown in tables 1 to 6. The tables also included a detailed break up of cost of each of the mixes.
Table 3 and Table 4 shows the quantities of raw materials of Self-Compacting Concrete designed as per IS 10262:2019 with industrial and agro wastes. Overall quantities of raw materials along with individual costs and total cost per cubic metre of concrete are shown. Table 5 and Table 6, Table 7 and Table 8 shows the quantities of raw materials of Self-Compacting Concrete designed based on the plastic viscosity of the mix with industrial and agro wastes. Two plastic viscosities 9 and 13 are chosen for the present study. For the given grade of concrete a user can adopt to varying plastic viscosities depending on the desired quantities of raw materials. The percentage replacement of supplementary cementitious materials is as per the suggestions given by technical experts from various ready-mix concrete plants and cement industries.
| Table 3: Raw Materials for SCC designed as per IS 10262:2019 with industrial waste | |||||
| Materials (kg/m3) | Raw Material Cost per kg | OPC | 20% Fly ash | 25% GGBS | 25% FA-GGBS |
| Cement | 7 | 440 | 352 | 330 | 220 |
| Fly Ash | 0.9 | 0 | 88 | 0 | 110 |
| GGBS | 3 | 0 | 0 | 110 | 110 |
| Water | 0.1 | 170 | 170 | 170 | 170 |
| Crushed Sand | 0.6 | 894 | 877 | 890 | 868 |
| Coarse Aggregate | 0.6 | 715 | 701 | 712 | 694 |
| Superplasticizer | 70 | 4.8 | 4.8 | 4.8 | 4.8 |
| Total Cost in Rs | 4230 | 4036 | 3786 | 3542 | |
| Table 4: Raw Materials for SCC designed as per IS 10262:2019 with industrial and agro waste | |||||
| Materials (kg/m3) | Raw Material Cost per kg | OPC | 15% RHA | 15% GGBS | 15% RHA-GGBS |
| Cement | 7 | 440 | 374 | 374 | 308 |
| Rice Husk Ash (RHA) | 0.9 | 0 | 66 | 0 | 66 |
| GGBS | 3 | 0 | 0 | 66 | 66 |
| Water | 0.1 | 170 | 170 | 170 | 170 |
| Crushed Sand | 0.6 | 894 | 877 | 890 | 868 |
| Coarse Aggregate | 0.6 | 715 | 701 | 712 | 694 |
| Superplasticizer | 70 | 4.8 | 4.8 | 4.8 | 4.8 |
| Total Cost in Rs | 4230 | 4079 | 3962 | 3806 | |
| Table 5: Raw Materials for SCC designed for Plastic Viscosity of 13 Pa.s industrial waste | |||||
| Materials (kg/m3) | Raw Material Cost per kg | OPC | 20% Fly ash | 25% GGBS | 25% FA-GGBS |
| Cement | 7 | 400 | 309 | 300 | 194 |
| Fly Ash | 0.9 | 0 | 77 | 0 | 97 |
| GGBS | 3 | 0 | 0 | 100 | 97 |
| Water | 0.1 | 200 | 193 | 200 | 194 |
| Crushed Sand | 0.6 | 937 | 964 | 937 | 943 |
| Coarse Aggregate | 0.6 | 772 | 754 | 772 | 756 |
| Superplasticizer | 70 | 5 | 4.83 | 5 | 4.85 |
| Total Cost in Rs | 4195 | 3621 | 3795 | 3115 | |
| Table 6: Raw Materials for SCC designed for Plastic Viscosity of 13 Pa.s industrial and agro waste | |||||
| Materials (kg/m3) | Raw Material Cost per kg | OPC | 15% RHA | 15% GGBS | 15% RHA-GGBS |
| Cement | 7 | 400 | 340 | 300 | 280 |
| Rice Husk Ash (RHA) | 0.9 | 0 | 60 | 0 | 60 |
| GGBS | 3 | 0 | 0 | 100 | 60 |
| Water | 0.1 | 200 | 193 | 200 | 194 |
| Crushed Sand | 0.6 | 937 | 964 | 937 | 943 |
| Coarse Aggregate | 0.6 | 772 | 754 | 772 | 756 |
| Superplasticizer | 70 | 5 | 4.83 | 5 | 4.85 |
| Total Cost in Rs | 4195 | 4068 | 3795 | 3818 | |
| Table 7: Raw Materials for SCC designed for Plastic Viscosity of 9 Pa.s industrial waste | |||||
| Materials (kg/m3) | Raw Material Cost per kg | OPC | 20% Fly Ash | 25% GGBS | 25% RHA-GGBS |
| Cement | 7 | 426 | 326 | 319 | 206 |
| Fly Ash | 0.9 | 0 | 82 | 0 | 103 |
| GGBS | 3 | 0 | 0 | 106 | 103 |
| Water | 0.1 | 213 | 204 | 213 | 206 |
| Crushed Sand | 0.6 | 904 | 918 | 900 | 894 |
| Coarse Aggregate | 0.6 | 755 | 753 | 753 | 752 |
| Superplasticizer | 70 | 4.27 | 4.08 | 4.25 | 4.11 |
| Total Cost in Rs | 4298 | 3664 | 3862 | 3140 | |
| Table 8: Raw Materials for SCC designed for Plastic Viscosity of 9 Pa.s industrial and agro waste | |||||
| Materials (kg/m3) | Raw Material Cost per kg | OPC | 15% RHA | 15% GGBS | 15% RHA-GGBS |
| Cement | 7 | 426 | 362 | 362 | 298 |
| Rice Husk Ash (RHA) | 0.9 | 0 | 64 | 0 | 64 |
| GGBS | 3 | 0 | 0 | 64 | 64 |
| Water | 0.1 | 213 | 204 | 213 | 206 |
| Crushed Sand | 0.6 | 904 | 918 | 900 | 894 |
| Coarse Aggregate | 0.6 | 755 | 753 | 753 | 752 |
| Superplasticizer | 70 | 4.27 | 4.08 | 4.25 | 4.11 |
| Total Cost in Rs | 4298 | 4163 | 4037 | 3895 | |
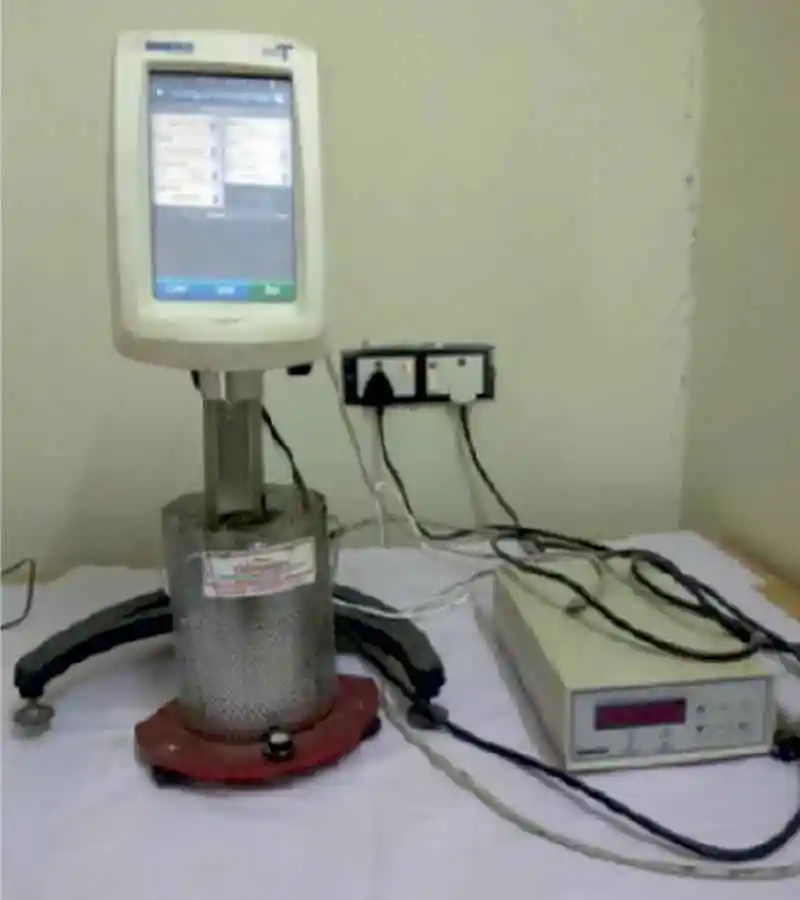 Figure 1: Brookfield Viscometer DV3T for measuring plastic viscosity of paste
Materials used
- Cement: Ordinary Portland Cement (OPC) of 53 grade is used for the present study. The physical and chemical composition of cement is shown in Table 1.
- Fly Ash: Class F Fly ash with low calcium content used for the present study is obtained from National Thermal Power Coal Plant, Ramagundam, in Telangana. The physical and chemical composition of fly ash is shown in Table 1.
| Table 1: Chemical and physical properties of Ordinary Portland Cement, fly ash and GGBS | |||
| Chemical Composition (%) | OPC | Fly Ash | GGBS |
| CaO | 65.232 | 1.78 | 40.64 |
| SiO2 | 18.635 | 60.13 | 35.15 |
| Al2O3 | 5.716 | 28.37 | 19.60 |
| Fe2O3 | 4.538 | 5.10 | 0.53 |
| SO3 | 4.324 | 0.11 | 1.89 |
| K2O | 0.591 | 2.16 | 0.40 |
| TiO2 | 0.499 | 1.42 | 0.92 |
| Physical Properties | |||
| Specific Gravity | 3.15 | 2.16 | 2.85 |
- GGBS: Ground Granulated Blast Slag is obtained from Jindal Steel Works, Vijayanagar, and Karnataka. The physical and chemical composition of GGBS is shown in Table 1.
- Fine Aggregate: Locally available Crushed Rock Fines (CRF) is used as a fine aggregate for the present study. It confirmed to IS 383: 1970. CRF was chosen over river sand to ensure that the organic impurities are minimized. The specific gravity used in the present study is 2.61. Fineness modulus of 2.00 is obtained and it belongs to Zone II.
- Coarse Aggregate: Basalt type coarse aggregate with a maximum particle size of 20mm is used for the present investigation. All the mixes for the current study adopted a combination of 10mm and 20mm size aggregates. The specific gravity and water absorption used in the present study are 2.71, 4.6% for 10mm and 1.6% for 20mm aggregates.
- Admixture: Master Glenium Sky 8233, a light brown liquid made of a new generation based on modified polycarboxylic ether is used as a superplasticizer for the current study. The specific gravity of 1.07 at 250 is adopted.
- Water: Potable tap water is used for mixing and curing purposes based on its usual satisfactory performance.
- Proportioning of Mixes: For the experimental investigations, SCC with two binary mixes and one ternary mix are considered apart from the control mix with pure OPC. In addition to cementitious materials, fine aggregate, coarse aggregate, water, superplasticizer, are used and their corresponding proportions are given in Table 2.
- Mixing, Casting and Curing: Forced type pan mixer is used for mixing the raw materials in required proportions. The entire mixing sequence is finished within 10 min for all the mixes.
- Testing Program: Four combinations of mixes designated as SCCC100, SCCC75G25, SCCC80F20, SCCC50F25G25 representing Self-Compacting Concrete with 100% Cement, 75% Cement+25% GGBS, 80% Cement+20% Fly Ash, 50% Cement+25% Fly Ash+25% GGBS are adopted in the current experimental program. Three different values of plastic viscosity of mix are assumed to be 7, 9 and 11 Pa s. Each of the combination of the four mixes has a separate measured plastic viscosity values as shown in Table 2.
| Table 2: Mix proportions of SCC for 1 Cum | ||||||||||
| Mix Composition | PV of mix | PV of Paste | W/B | OPC (kg/m3) |
Fly Ash (kg/m3) |
GGBS (kg/m3) |
Water (kg/m3) | CRF (kg/m3) |
Coarse Aggregate (kg/m3) |
SP (kg/m3) |
| SCCC100 | 7 | 0.17 | 0.57 | 379 | 0 | 0 | 217 | 870 | 823 | 2.46 |
| SCCC80F20 | 0.16 | 296 | 74 | 0 | 212 | 915 | 770 | 2.4 | ||
| SCCC75G25 | 0.18 | 285 | 0 | 95 | 218 | 871 | 811 | 2.47 | ||
| SCCC50F25G25 | 0.20 | 187 | 94 | 94 | 215 | 869 | 790 | 2.43 | ||
| SCCC100 | 9 | 0.17 | 0.57 | 364 | 0 | 0 | 209 | 895 | 838 | 2.35 |
| SCCC80F20 | 0.16 | 285 | 71 | 0 | 204 | 940 | 784 | 2.30 | ||
| SCCC75G25 | 0.18 | 272 | 0 | 91 | 209 | 895 | 829 | 2.34 | ||
| SCCC50F25G25 | 0.20 | 179 | 90 | 90 | 206 | 896 | 806 | 2.32 | ||
| SCCC100 | 11 | 0.17 | 0.57 | 352 | 0 | 0 | 202 | 909 | 852 | 2.28 |
| SCCC80F20 | 0.16 | 276 | 69 | 0 | 198 | 951 | 799 | 2.24 | ||
| SCCC75G25 | 0.18 | 264 | 0 | 88 | 202 | 907 | 845 | 2.29 | ||
| SCCC50F25G25 | 0.20 | 174 | 87 | 87 | 200 | 913 | 817 | 2.25 | ||
PV - Plastic viscosity, W/B - Water to Binder ratio, OPC - Ordinary Portland Cement, GGBS - Ground granulated blast furnace slag, SP - Superplasticizer.
| Table 3: Recommendations for SCC-EFNARC Guidelines (2005) | |||||
| Slump Flow (mm) |
T50 (sec) |
J-Ring Spread (mm) |
V-Funnel (sec) |
L-box Blocking ratio H2/H1 | |
| Minimum | 650 | 2 | - | 6 | 0.8 |
| Maximum | 800 | 5 | - | 12 | 0.1 |
| Table 4: Details of SCC mixes | |||||
| Mix | Target Plastic Viscosity | Actual Plastic Viscosity | Vol. of Paste | Vol. of Solid | Paste/Solid (by vol) |
| SCCC100 | PV-7 | 7.206 | 0.35 | 0.65 | 0.54 |
| SCCC80F20 | 7.206 | 0.35 | 0.65 | 0.54 | |
| SCCC75G25 | 7.176 | 0.35 | 0.65 | 0.54 | |
| SCCC50F25G25 | 7.17 | 0.36 | 0.64 | 0.56 | |
| SCCC100 | PV-9 | 9.208 | 0.33 | 0.67 | 0.49 |
| SCCC80F20 | 9.2 | 0.34 | 0.66 | 0.52 | |
| SCCC75G25 | 9.166 | 0.34 | 0.66 | 0.52 | |
| SCCC50F25G25 | 9.163 | 0.34 | 0.65 | 0.52 | |
| SCCC100 | PV-11 | 11.185 | 0.32 | 0.68 | 0.47 |
| SCCC80F20 | 11.182 | 0.33 | 0.67 | 0.49 | |
| SCCC75G25 | 11.129 | 0.33 | 0.67 | 0.49 | |
| SCCC50F25G25 | 11.133 | 0.33 | 0.66 | 0.5 | |
Results and Discussions
Fresh Properties
The properties of SCC for its fresh state are assessed to check the requirements of filling, passing and segregation resistance. All the tests are performed as per the European guidelines given in EFNARC. The standard range of values for fresh properties as per EEFNARC guidelines are as per Table 3. The properties tested are Slump flow diameter, Slump flow time (T50), V-funnel flow time, J-ring flow diameter. All the SCC mixes have shown a satisfactory flow values ranging from 685mm to 725mm (Fig. 2). Mixes with fly ash resulted in good deformability due to its own weight compared to mixes with GGBS. As the fly ash particles are spherical in shape, a partial replacement of cement with fly ash will increase the paste content which in turn increases the cohesiveness and workability of the mix. With the increase in the plastic viscosity of the mix slump flow decreased. Reduction of paste content with increase in solid content for an increasing plastic viscosity will decrease the slump flow.
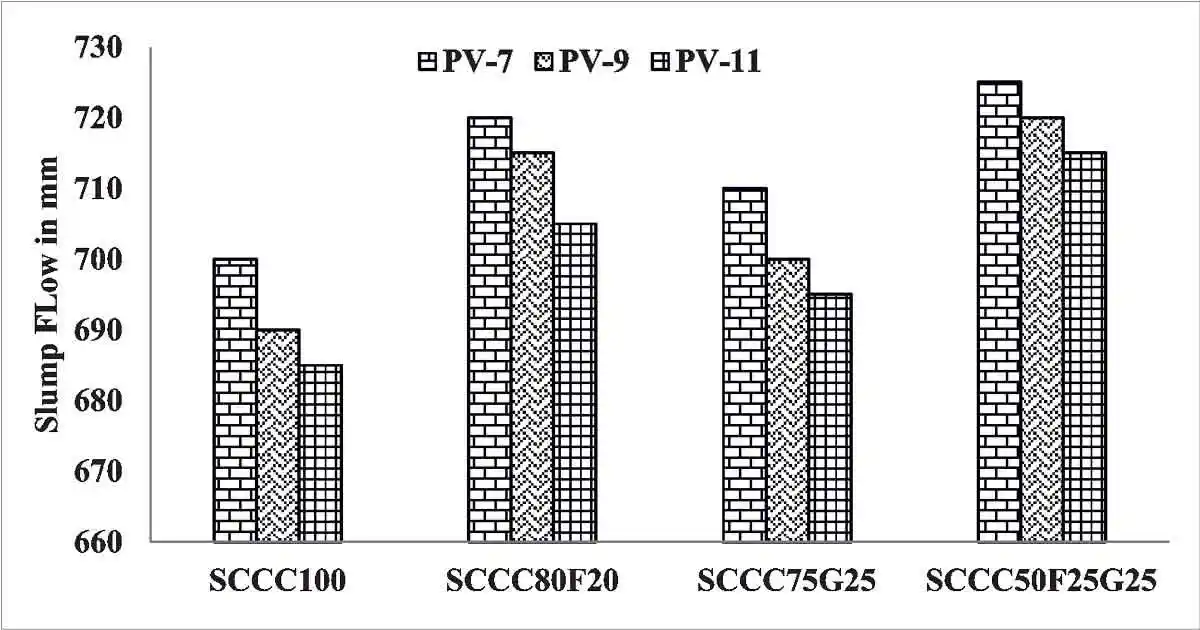 Figure 2: Slump flow for SCC mixes
For all the SCC mixes, the slump flow time recorded (i.e., T50) is ranging from 1.5 to 2.4 seconds (Fig. 3). T500 is an indicative measure of the viscosity of the mix. It increased with increase in the plastic viscosity of the mix. This property is an indicative tool when there is a requirement for the good surface finishing. As the proposed mix design is based on the plastic viscosity of the mix, the obtained values for T500 are in good agreement with the viscous behavior of SCC mixes.
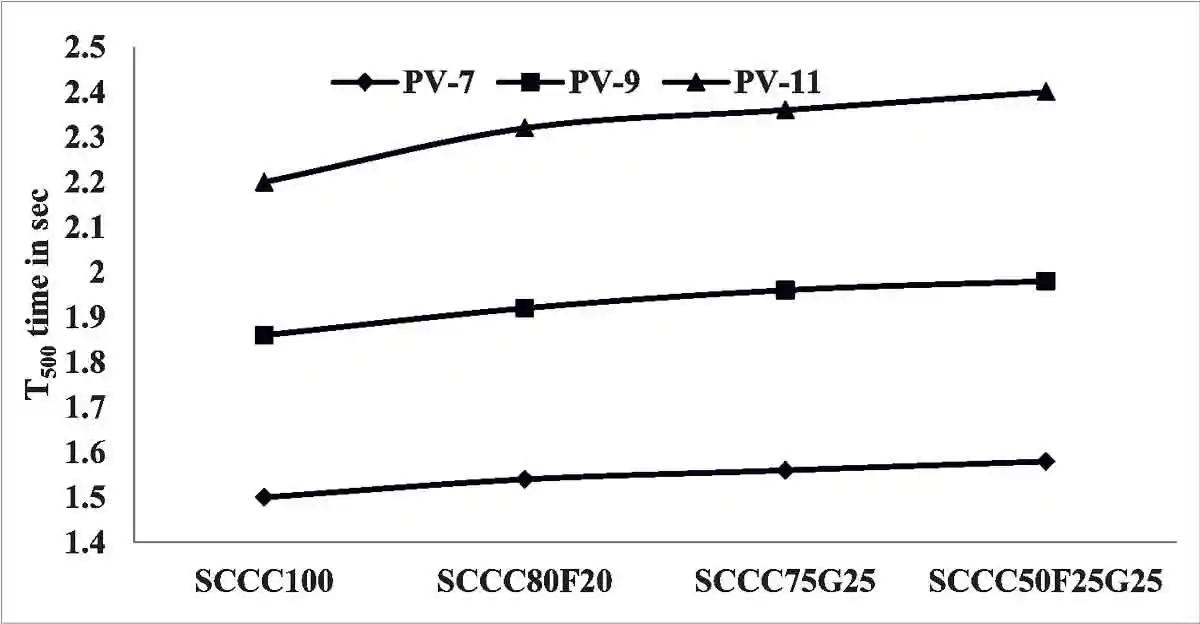 Figure 3: T50 for SCC mixes
To assess the passing ability of SCC mixes, J-Ring in combination with slump cone mold is used to find the distance of lateral flow of concrete. Spread for J-Ring is measured and the values are ranging from 665mm to 710mm (Fig. 4).
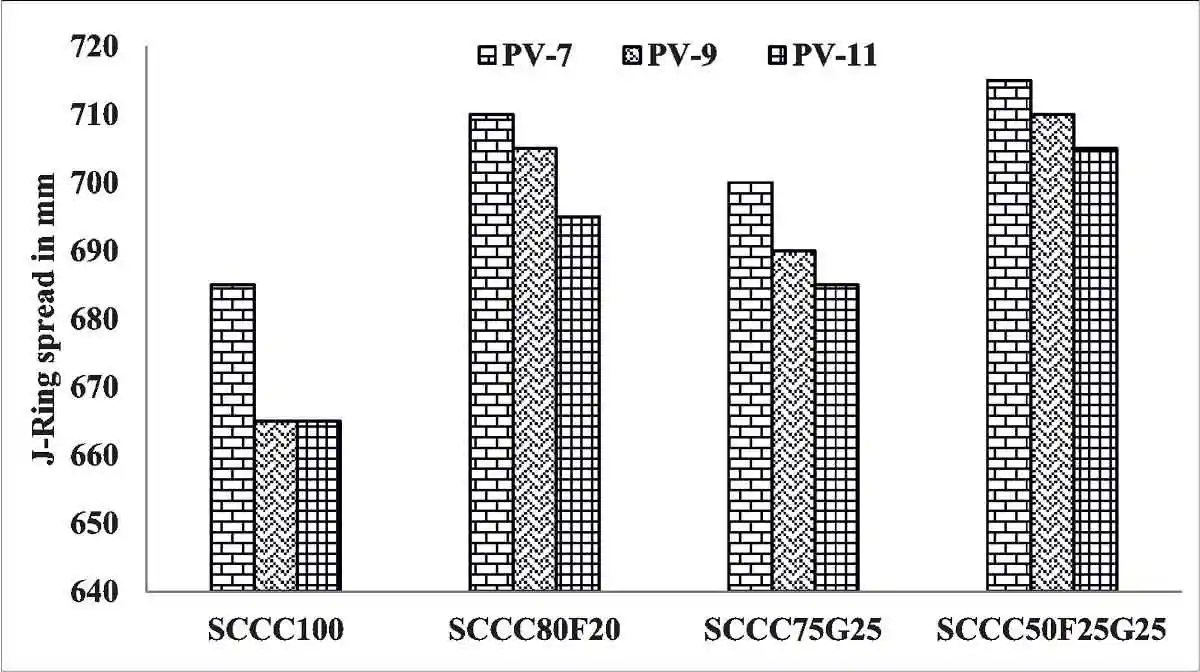 Figure 4: J-Ring spread for SCC mixes
As the major portion of size of aggregate used is less than 20mm, blocking is minimal and the mix has got a good spread passing through the obstacles in the form of reinforcement. The difference between slump flow and J-Ring flow for all the mixes is less than 25mm which is in good agreement with [ASTM C 1621/C 1621M] indicating a good passing ability of the concrete (Fig. 4). Viscosity and filling ability in terms of duration of flow of mix is investigated using V-funnel test. V-funnel time measured for SCC mixes ranged from 6 to 10 seconds (Fig. 5) which are in good agreement with EFNARC guidelines.
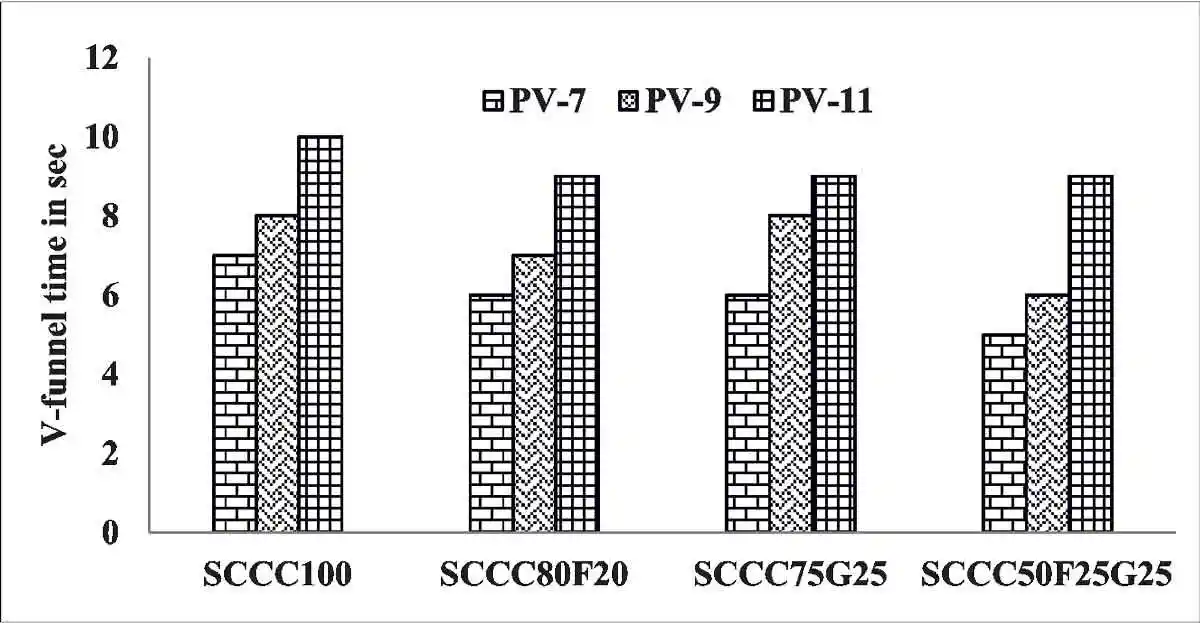 Figure 5: V-Funnel time for SCC mixes
V-funnel time for SCC mixes is also an indication that the proposed mix design based on plastic viscosity is reliable and compatible with the existing standard guidelines. Mixes with increasing plastic viscosity because of the decreasing paste content increased the flow time. The usage of 100% CRF as fine aggregate is also an influencing factor for the better performance of the mix.
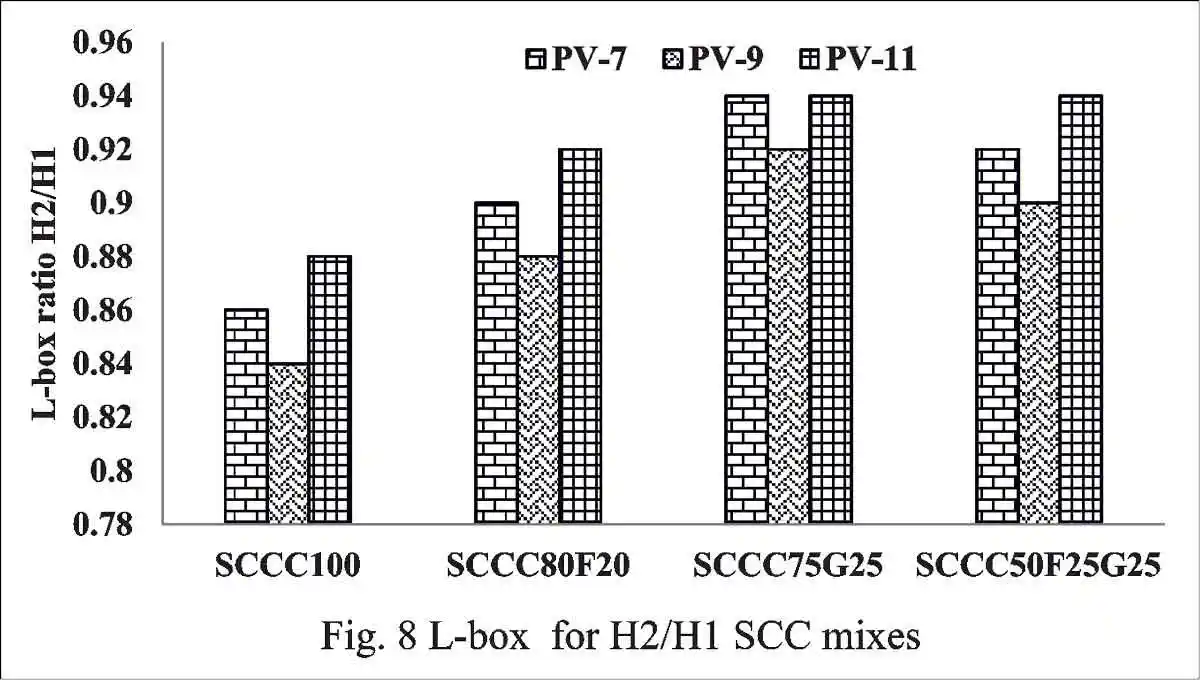 Figure 6: L-box for H2/H1 SCC mixes
To assess the filling and passing ability of SCC L-Box test is performed. The ratio of heights at the two edges of L-box (H2/H1), are recorded. If the ratio is less than 0.8, then this test is more sensitive to blocking. All the SCC mixes are within the range of 0.8 to 1.0 (Fig. 6) as per EFNARC standards. Because of the presence of CRF in the mix, it enhances the overall performance of flowing and passing ability of the mix. The fines present in CRF acted as an inert material thus increasing the powder content without reacting with water making the mix more cohesive. The use of CRF in combination with SCMs will result in energy efficient SCC mixes which will be practically feasible and economically viable. Filling and passing as per standard tests are shown in (Fig. 7)
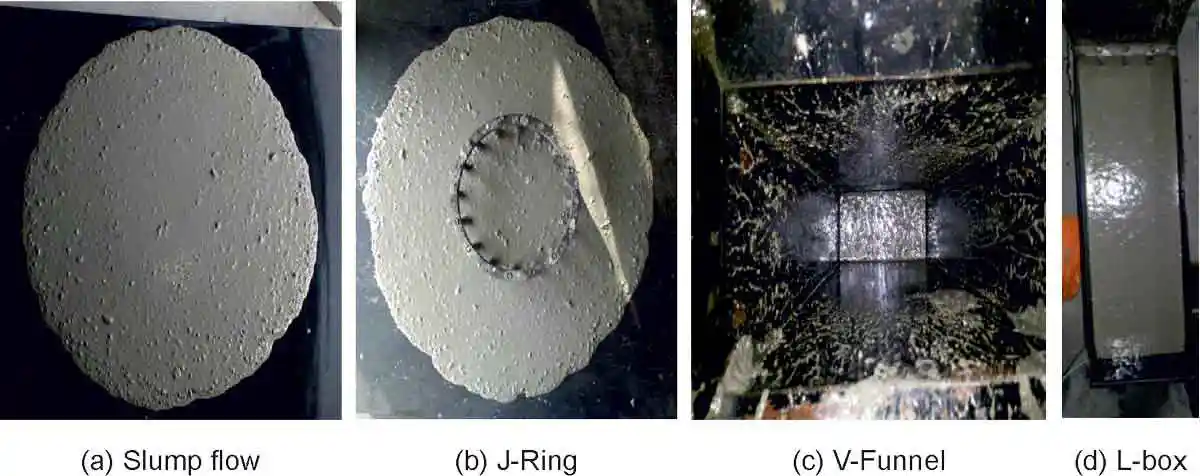 Figure 7: Fresh properties of SCC
Hardened Properties
A 300 Ton Compressive Testing Machine is used to estimate the compressive strength of concrete. Compressive strength depends on many parameters such as water to cement ratio, type of cement replacement materials, percentage of coarse aggregate, plastic viscosity of the paste and assumed plastic viscosity of mix. From (Fig. 8 and Fig. 9) the following observations are made for different combinations of SCC mixes. SCC mix with 100% OPC resulted in maximum compressive strength of 48.16 MPa, 43.5 and 40.14 for and 60.14, 52.4 and 47.56 MPa 28 days for plastic viscosities of 7, 9 and 11 because of the dominant presence of calcium. SCC mixes with 25% replacement of GGBS resulted in a compressive strength of 35.3, 32.2, and 29.94 for 7 days and 50.76, 44.8, and 40.14 for 28 days for plastic viscosities of 7, 9 and 11. SCC mix with 20% Fly ash resulted in strength of 35.3, 30.2, and 27.38 for 7 days and 46.72, 40.6 and 36.62 for 28 days for plastic viscosities of 7, 9 and 11. Due to the presence of pozzolanic reactions in GGBS and fly ash the strength decreases because of its high C2S content. SCC mixes with ternary combinations resulted in a strength equal to 30.12, 27.6 and 25.88 for 7 days and 44.3, 38.7 and 36.66 for 28 days for plastic viscosities of 7, 9 and 11. There is a significant reduction in strength compared to binary mixes. The reduction is mainly influenced by the 25% of fly ash present in the mix. There is a significant percentage reduction in 28 days strength of mix with 20% fly ash replacement when compared to mix with 100% OPC. Replacement of cement with fly ash will reduce the heat of hydration which sacrifices the early strength. Sometimes the process of hydration for mixes with fly ash will be prolonged from 90 days to 365 days depending upon the reactive particles in fly ash. It is also observed that the strength loss in fly ash mixes is mainly due to its slow pozzolanic reaction and the dilution effect (W. Wongkeo, et al, 2014). With the increase in plastic viscosity of the mixes, the compressive strengths decreased as the cementitious content decreased. An assumed plastic viscosity of 9 Pas is found to be suitable for the adopted M40 grade of concrete based on the requirements of the construction.
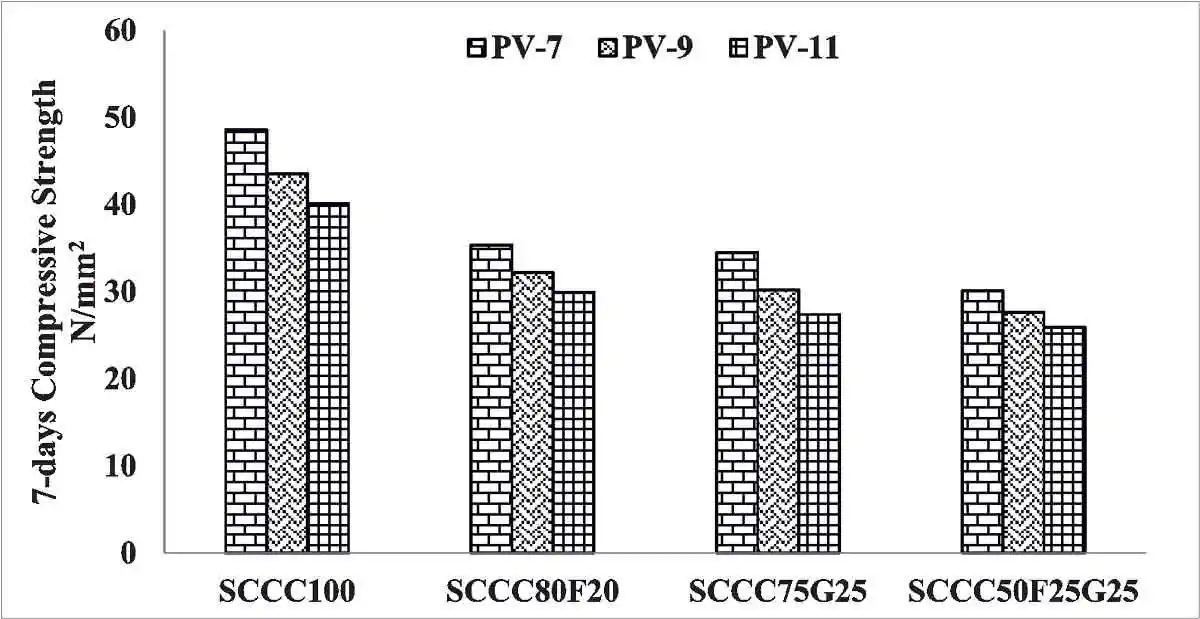 Figure 8: 7 - days Compressive strength for SCC mixes
Table 5 shows that, the percentage difference between assumed and calculated values of plastic viscosity of all the SCC mixes are within the proposed limits of ±5%. It is also observed that the water to cement ratio adopted for the four mixes is under predicting the strength characteristics of binary and ternary mixes with fly ash after 28 day. At a higher water to cement ratio, cement paste gets diluted which in turn leads to shrinkage cracks. More water in a SCC mix will enlarge the spacing of cement particles weakening the bond at aggregate and mortar interface leading to the formation of micro cracks (D.P. Bentz, et al, 1999). The mixes with plastic viscosity of 7 Pas are exceeding the maximum water content as per EFNARC guidelines and hence should be avoided because of the aforementioned reason.
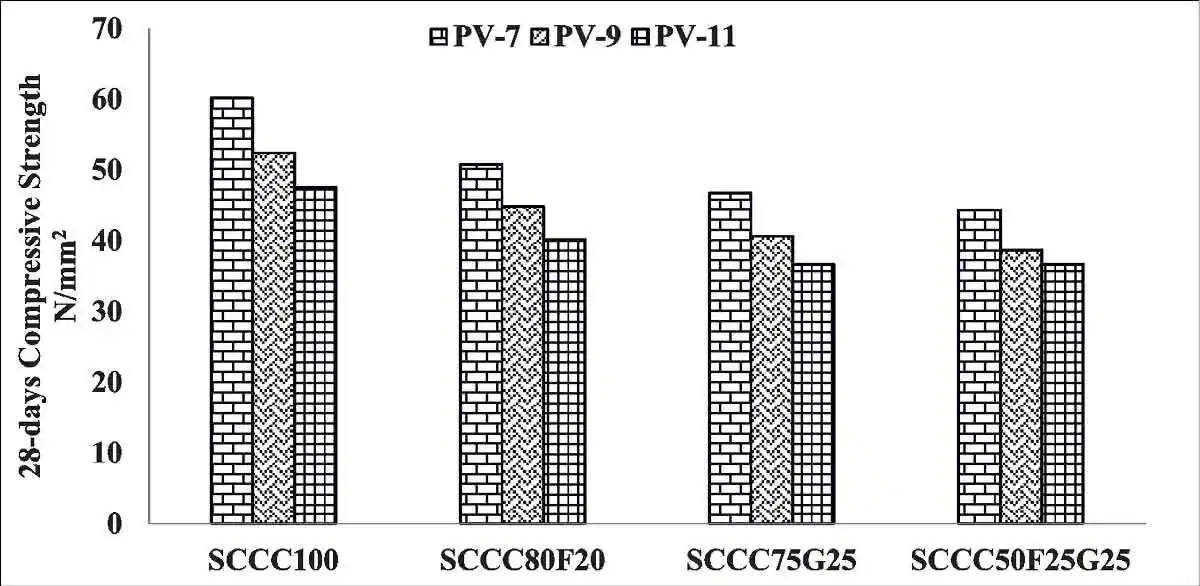 Figure 9: 28 - days Compressive strength for SCC mixes
| Table 5: Assumed and calculated plastic viscosity | |||
| Mix Composition | Assumed Plastic Viscosity | Calculated Plastic Viscosity | % difference |
| SCCC100 | 7 | 7.206 | 2.86 |
| SCCC80F20 | 7.206 | 2.86 | |
| SCCC75G25 | 7.176 | 2.45 | |
| SCCC50F25G25 | 7.17 | 2.37 | |
| SCCC100 | 9 | 9.208 | 2.26 |
| SCCC80F20 | 9.2 | 2.17 | |
| SCCC75G25 | 9.166 | 1.81 | |
| SCCC50F25G25 | 9.163 | 1.78 | |
| SCCC100 | 11 | 11.185 | 1.65 |
| SCCC80F20 | 11.182 | 1.63 | |
| SCCC75G25 | 11.129 | 1.16 | |
| SCCC50F25G25 | 11.133 | 1.19 | |
Conclusions
Mix proportioning of Self-Compacting concrete was carried out as per IS 10262:2019 and plastic viscosity of the mix. The following are the observations from the study
- Plastic viscosity of the paste has been successfully used to proportion the self-compacting concrete mixes
- Cost of the mix increases with decrease in plastic viscosity of the mix
- Plastic viscosity based mix proportioning of SCC is economical compared to IS 10262:2019
- Ternary mixes at an acceptable replacement levels of fly ash upto 25% and GGBS upto 25% is found to be acceptable and economical
- Mixes with agro waste like Rice Husk Ash are uneconomical compared to mixes with industrial waste
- It is observed that the plastic viscosity of the paste has an influential role on the compositions of the mix. It mainly depends on the type of cementitious material, water to cement ratio and superplasticizer dosage.
- Measured values of T50 time and V-funnel time, indicates that both the values are in good agreement with the proposed mix design with assumed plastic viscosity of the mix. There is a direct correlation between plastic viscosity and T50.
- Slump flow diameter and time are in par with the standard EFNARC guidelines, which indicates that the proposed mix design has got good flowability and stability for SCC mixes.
- With the increase in the plastic viscosity of the mix, slump flow, T500 and J-ring spread increased but V-funnel and L-box decreased.
- The use of CRF as a fine aggregate resulted in a very good flowable and stable SCC mix which encourages the use of locally available materials as an alternate to river sand.
- Increase in plastic viscosity of the mix for a constant water to cement ratio has a significant effect on the fresh properties as well as compressive strength of concrete.
- It is also recommended to adopt a plastic viscosity of 9 for a ternary mix with CRF as fine aggregate to proportion the chosen M40 grade of concrete.
The author is thankful to Mr. K. Srinivasu and Mr. P Sai Saran, IJM Concrete, Hyderabad for their valuable suggestions while formulating the mix design using plastic viscosity.
References
- Ozawa, K., (1989). High performance concrete based on the durability design of concrete structures. In The Second East Asia-Pacific Conference on Structural Engineering & Construction.
- Okamura, H., (1995). Ozawa, and Kazumasa: ‘Mix design for self-compacting concrete’ concrete Library of JSCE No. 25.
- Okamura, H. and Ouchi, M., (2003). Self-compacting concrete. Journal of advanced concrete technology, 1(1), pp.5-15.
- Khayat, K.H., (1999). Workability, testing, and performance of self-consolidating concrete. ACI materials journal, 96, pp.346-353.
- Khayat, K.H. and Guizani, Z., (1997). Use of viscosity-modifying admixture to enhance stability of fluid concrete. ACI Materials Journal, 94(4), pp.332-340.
- Mindess, S., Young, J.F. and Darwin, D., (2003). Concrete. Prentice Hall.
- Khatib, J.M., (2008). Performance of self-compacting concrete containing fly ash. Construction and Building Materials, 22(9), pp.1963-1971.
- Gesoğlu, M., Güneyisi, E. and Özbay, E., (2009). Properties of self-compacting concretes made with binary, ternary, and quaternary cementitious blends of fly ash, blast furnace slag, and silica fume. Construction and Building Materials, 23(5), pp.1847-1854.
- Mahdikhani, M., & Ramezanianpour, A. A. (2014). Mechanical properties and durability of self-consolidating cementitious materials incorporating nano silica and silica fume. Computers & Concrete, 14(2), 175-191.
- Liu, M., (2010). Self-compacting concrete with different levels of pulverized fuel ash. Construction and Building Materials, 24(7), pp.1245-1252.
- Dinakar, P., Sethy, K.P. and Sahoo, U.C., (2013). Design of self-compacting concrete with ground granulated blast furnace slag. Materials & Design, 43, pp.161-169.
- Chen, Y.Y., Tuan, B.L.A. and Hwang, C.L., (2013). Effect of paste amount on the properties of self-consolidating concrete containing fly ash and slag. Construction and Building Materials, 47, pp.340-346.
- Fathi, H., and Lameie, T., (2017). Effect of aggregate type on heated self-compacting concrete. Computers &Concrete, 19(5), 033-039.
- Nepomuceno, M.C., Pereira-de-Oliveira, L.A. and Lopes, S.M.R., (2014). Methodology for the mix design of self-compacting concrete using different mineral additions in binary blends of powders. Construction and Building Materials, 64, pp.82-94.
- Shi, C., Wu, Z., Lv, K. and Wu, L., (2015). A review on mixture design methods for self-compacting concrete. Construction and Building Materials, 84, pp.387-398.
- Khan, A., Do, J., & Kim, D. (2016). Cost effective optimal mix proportioning of high strength self-compacting concrete using response surface methodology. Computers &Concrete, 17(5), 629-638.
- Dransfield, J., 2003. Mortar and grout. Advanced Concrete Technology Set, p.69
- Mohebbi, A., Shekarchi, M., Mahoutian, M., & Mohebbi, S. (2011). Modeling the effects of additives on rheological properties of fresh self-consolidating cement paste using artificial neural network. Computers & Concrete, 8(3), 279-292.
- Hočevar, A., Kavčič, F. and Bokan-Bosiljkov, V., (2012). Rheological parameters of fresh concrete–comparison of rheometers, GRAĐEVINAR 65 (2), 99-109
- Ferraris, C.F., Brower, L.E. and Banfill, P., (2001). Comparison of Concrete Rheometers: International Test at LCPC (Nantes, France) in October, 2000. Gaithersburg, MD, USA: National Institute of Standards and Technology.
- Ghanbari, A. and Karihaloo, B.L., (2009). Prediction of the plastic viscosity of self-compacting steel fibre reinforced concrete. Cement and Concrete Research, 39(12), pp.1209-1216.
- Abo Dhaheer, M.S., Al-Rubaye, M.M., Alyhya, W.S., Karihaloo, B.L. and Kulasegaram, S., (2016). Proportioning of self–compacting concrete mixes based on target plastic viscosity and compressive strength: Part I-mix design procedure. Journal of Sustainable Cement-Based Materials, 5(4), pp.199-216.
- Abo Dhaheer, M.S., Al-Rubaye, M.M., Alyhya, W.S., Karihaloo, B.L. and Kulasegaram, S., (2016). Proportioning of self-compacting concrete mixes based on target plastic viscosity and compressive strength: Part II-experimental validation. Journal of Sustainable Cement-Based Materials, 5(4), pp.217-232.
- Krieger, I.M. and Dougherty, T.J., (1959). A mechanism for non‐Newtonian flow in suspensions of rigid spheres. Transactions of the Society of Rheology, 3(1), pp.137-152.
- Struble, L. and Sun, G.K., (1995). Viscosity of Portland cement paste as a function of concentration. Advanced Cement Based Materials, 2(2), pp.62-69.
- Gandage, A.S., Rao, V.V., Sivakumar, M.V.N., Vasan, A., Venu, M. and Yaswanth, A.B., (2013). Effect of perlite on thermal conductivity of self-compacting concrete. Procedia-Social and Behavioral Sciences, 104, pp.188-197.
- Wongkeo, W., Thongsanitgarn, P., Ngamjarurojana, A. and Chaipanich, A., (2014). Compressive strength and chloride resistance of self-compacting concrete containing high level fly ash and silica fume. Materials & Design, 64, pp.261-269.
- Bentz, D.P., Garboczi, E.J., Haecker, C.J. and Jensen, O.M., (1999). Effects of cement particle size distribution on performance properties of Portland cement-based materials. Cement and Concrete Research, 29(10), pp.1663-1671.
- EFNARC, S., (2002). Guidelines for self-compacting concrete. EFNARC, UK (www. efnarc. org), pp.1-32.
- BIS (Bureau of Indian Standards) (1970) 383: Specification for Coarse and Fine Aggregates from Natural Sources for Concrete, India.
- ASTM (American Society for Testing and Materials) (2014) C 1621/C 1621M: Standard Test Method for Passing Ability of Self-Consolidating Concrete by J-Ring
- Concrete fact sheet, www.nrmca.org. (Browsed on 27/10/2016).
- Rama, J. S., Sivakumar, M. V. N., Kubair, K. S., & Vasan, A. (2019). Influence of plastic viscosity of mix on Self-Compacting Concrete with river and crushed sand. Computers and Concrete, 23(1), 37-47.
- RAMA, S. K. (2018). Proportioning of Self Compacting Concrete Mixes Based on Plastic Viscosity Approach-Experimental and Numerical Investigations (Doctoral dissertation, BITS Pilani).
- Kalyana Rama, J. S., Pallerla, S., Sivakumar, M. V. N., Vasan, A., & Ramachandra Murthy, A. (2017). Parametric Study on the Influence of Cement Replacement Materials on the Rheology of Cement Paste using Brookfield Viscometer. CONSTRUCTION MATERIALS AND SYSTEMS, 23.
- Kalyana Rama, J. S., Sivakumar, M. V. N., Vasan, A., Kubair, S., & Ramachandra Murthy, A. (2017). Plastic viscosity based mix design of self-compacting concrete with crushed rock fines. Computers and Concrete, 20(4), 461-468.
Published on:
08 December 2020
Published in: NBM&CW December 2020
Share:
We Value Your Comment