Squeezing Ground Conditions in Rishikesh-Karnaprayag Railway Tunnel Project

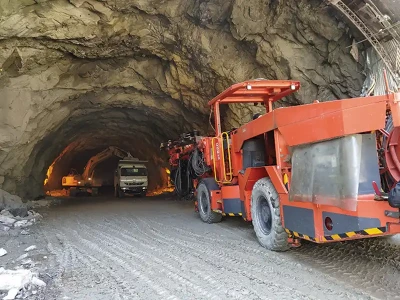
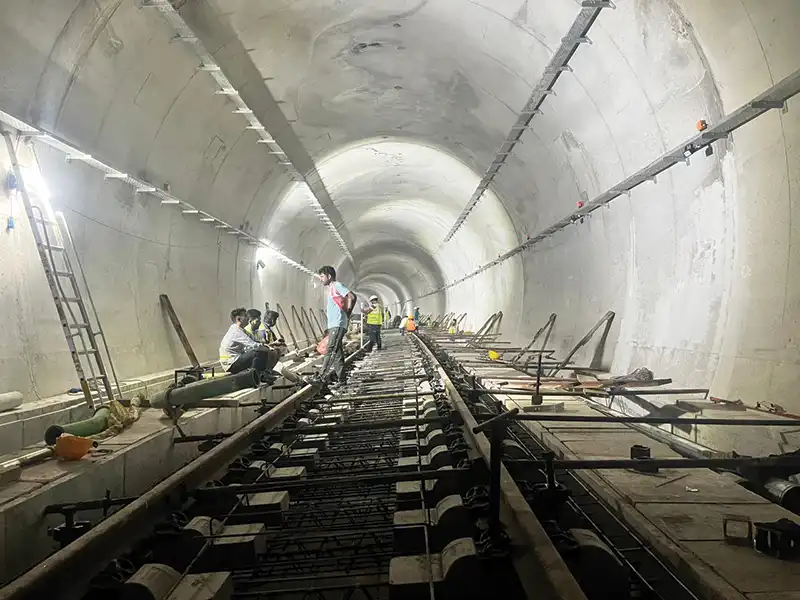
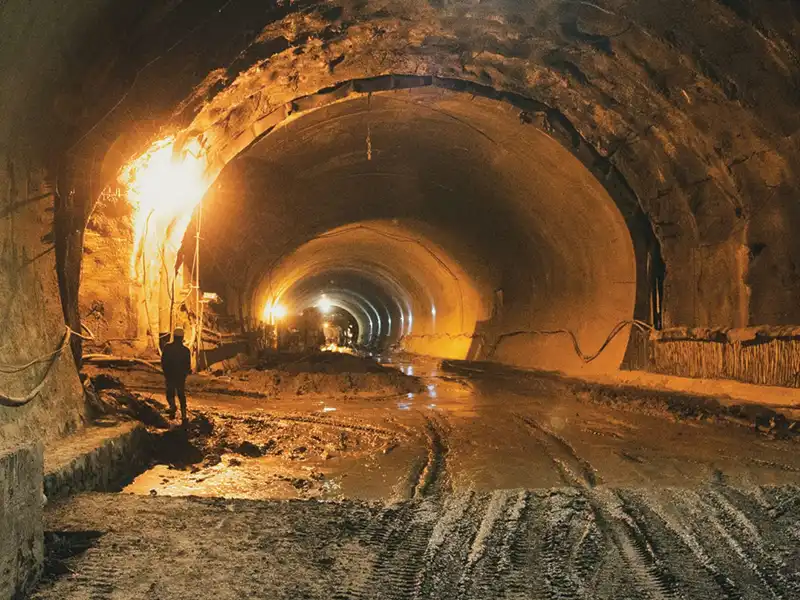
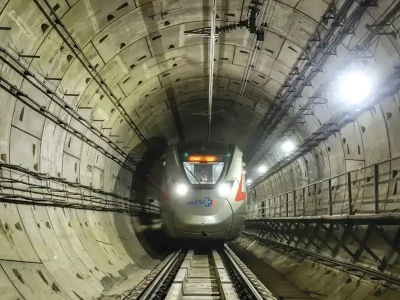
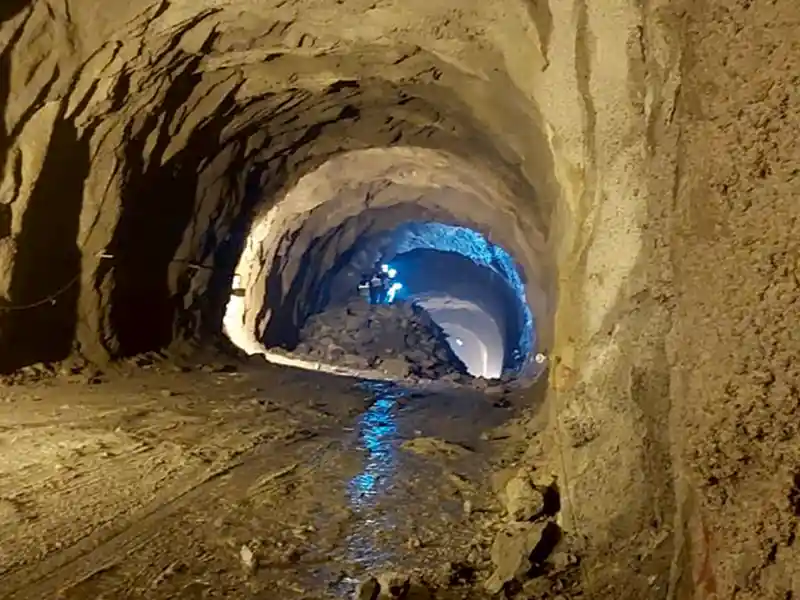
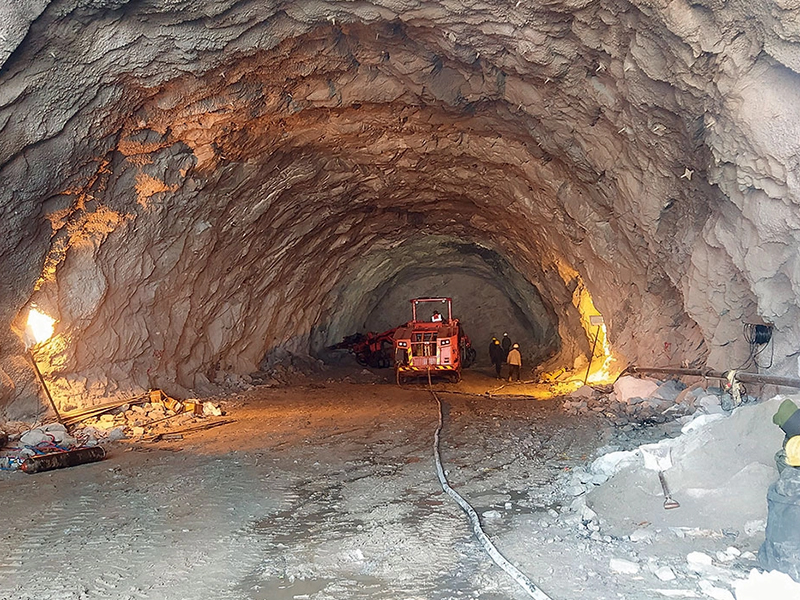
The new railway line between Rishikesh and Karnaprayag is under construction in the State of Uttarakhand, India, with a total length of 125km. Package 4 of the project includes 10.490km (twin bore TBM tunnel, upline downline) being constructed using two 9.11m diameter single shield hard rock TBMs. Rock masses such as shale, slate, phyllite and schist, and the rock mass of weakness/fault zones are incapable of sustaining high stresses in such high overburdened tunnels which leads to squeezing ground conditions during tunnel construction in the tectonically active Himalayan region.

package 4 is not an exception and mostly consists of high schistose phyllite and quartzite phyllite rock mass being considered in TBM specifications which enables one to investigate the ground ahead of the TBM and monitor the constructed tunnel, aimed towards reducing the risk, using state-of-the-art technologies. Squeezing potential of rock strata along the mechanized tunnel part is being assessed with empirical, semi-empirical, analytical, and numerical methods based on the geotechnical and geomechanical parameters of the rocks, identified/interpreted in the tunnel route and presented through Geotechnical reports (GBR– Geotechnical Baseline, GDR – Geotechnical Data, GIR – Geotechnical Interpretative) before tunnel construction and expected squeezing behaviour under average to high overburden conditions, which is also being evaluated during tunnel construction with the actual tunnel convergence measured around the shield.
Void measurements around the shield is being done by adapting three special instruments along the shield near the tunnel crown to measure the void above, after each advance and during stoppages of the TBMs. Comparison of the analytical and numerical analysis with the actual data collected in the first 2.7 km of the upline drive shows good co-relations, mostly with the previous studies done in the Himalayan region.
Introduction

The 125 km length railway line between Rishikesh and Karnaprayag in the State of Uttarakhand, India comprises of 17 tunnels 12 stations and 35 bridges. Tunnel 8 (Package 4) of the project from chainage 47+360 to 63+117, includes 15.1 km double line tunnel located between Devprayag and Janasu (Figure 1), out of which 10.490km (twin-bored TBM tunnel) being constructed using two 9.11 m diameter single shield hard rock TBMs (Figure 2). Tunnel and TBM general specifications are mentioned in Table 1.
TBM Investigation and monitoring devices
The utilization of shielded TBMs for the Rishikesh to Karnaprayag railway project Package 4 is a viable option, given the favourable conditions of the rock strata specified in the GBR, the expected topographical advantages along the tunnels, and the positive social, environmental, and financial considerations. To enhance the operation of these TBMs, state-of-the-art technologies have been incorporated, which offer the capability to precisely control the machines' advance rate and simultaneously assess the rock strata ahead of the TBM face and the excavated tunnel. These technologies include:

- Exploratory probe drilling: Used to investigate the ground ahead of the TBM cutterhead through 20 inclined drill holes within the TBM shield perimeter and 6 horizontal drill channels through the cutterhead.
- Seismic investigation equipment: Enables extended investigation of the rock mass body in front of the TBM and verifies direct investigations conducted through boreholes and probe holes.
- Disc cutter load monitoring system (DCLM): Monitors the load on four disc-cutters positioned at different locations (radii) on the cutterhead while it rotates, providing insights into the rock strength in various positions on the face.
- Ring convergence monitoring system (RCMS): Monitors deformation and convergence of the segmental ring through effective measurements using a wireless system starting immediately after the ring installation.
- Muck weighing equipment: Measures the weight of the excavated material via the TBM conveyor belt.
- Variably sized TBM shields: Employed to create additional space in the tail shield to accommodate ground convergence during shield advance.
- Facilities to overcut up to 9310mm diameter by shifting the 19” gauge cutters and changing with 20” disc cutters.
- Void measurement system (VMS): Measures the void between the shield and the rock using three cylinders in the front and middle shield’s roof section. This system operates during TBM stoppages, such as during ring building. Continuous measurements during each advance, considering the distance between these cylinders (1,700mm as illustrated in Figure 3), allows for the recording of ground convergence in the same position during subsequent measurements.
Geological and geotechnical properties

The single shield TBMs shall excavate the twin tunnels of about 10.5km each through the Chandpur formations of Jaunsar group comprising mainly of phyllite and quartzitic phyllite with varying content of quartzite in them. Several drill hole investigations along with laboratory and geophysical investigations were performed to evaluate the rock mass conditions along the tunnel. The drill holes up to 600m deep were conducted to verify the expected site conditions based on site topography and geological traversing and mapping.

The in-situ state of stress was inferred from the hydrofracture field tests performed at the site. Vertical stress is one of the principal stresses and is due to gravity loading. The best estimates for the in-situ stress ratio for different overburdens and zones are calculated using Sheorey’s equation validating from the site test results. The state of stress in the horizontal plane is considered isotropic. Figure 4 shows geological longitudinal section of Package 4 and Table 2 represents the best and cautious estimates of various geomechanical properties along the various critical sections of the TBM tunnel drives.

Squeezing analysis approach and methodology
Squeezing of the host ground is the large time-dependent deformations that occur around the tunnel geometry. The time-dependent deformations are produced by the disturbance of the primitive stress field due to the excavation of the tunnel. The rock mass around the tunnel boundaries is strained under the influence of induced stresses. The deformations may terminate during construction or continue over a long period of time (Barla, 1995). In the landmark paper on tunnelling by Karl Terzaghi (1946), the prerequisite of the squeezing ground conditions is defined as the high percentage of microscopic or sub-microscopic particles of micaceous minerals or of clay minerals with low swelling capacity. Following the definitions of Terzaghi, several approaches are identified by various authors to assess the potential of squeezing problems in tunnelling.
Singh et al. (1992) an empirical approach

Using 39 individual case histories primarily from Himalayan formations, the study conducted by Singh et al. (1992) in which they collected data on rock mass quality (Q) and overburden, led to establishment of a discernible boundary line, clearly distinguishing between squeezing and those of non-squeezing rock, as presented in Equation 1, in which data points positioned above this demarcation line signify instances of squeezing conditions.
H=350 Q1⁄3 (1) Where, H is overburden (m); Q is rock mass quality (Barton et al. 1974).
Goel et al. (1995) an empirical approach
Goel et al. (1995) proposed a straightforward empirical method that utilizes the rock mass number N. This number is defined as the stress-free Q, aiming to mitigate the uncertainties associated with determining the accurate rating of the Stress Reduction Factor parameter in Barton et al.'s (1974) Q. The definition is
N=(Q)SRF=1 (2)
Goel et al. (1995) conducted a comprehensive analysis of tunnel sections, taking into account overburden depth (H), tunnel span or diameter (B), and the rock mass number (N) and generated a log-log diagram (Figure 5) in which the plotted data points revealed a clear distinction between squeezing and non-squeezing cases, represented by Equation 3.
H=(275N0.33)B-1 (3)
Verman (1993) an empirical approach
In a field study involving nine Himalayan tunnels, Verman (1993) employed the ground reaction curves (GRC). Through the use of empirical correlations and the GRC, Verman developed a design chart for classifying ground conditions into three categories: self-supporting, non-squeezing, and squeezing. In this approach the maximum tunnel span (Bs) that the ground can sustain without experiencing squeezing is defined as Equation 4.
Bs =3.2Q0.4 (4)
Based on the actual span and the span defined in Equation 4, the ground is categorized as follows:
- Self-supporting if B - Bs < 0,
- Non-squeezing if H (B - Bs)0.1 < 483Q1/3,
- Squeezing or rock burst if H (B - Bs)0.1 > 483Q1/3.
Where, H is overburden (m); Bs is tunnel span; Q is rock mass quality (Barton et al. in 1974).
Jethwa et al. (1984) a semi-empirical approach
Jethwa et al. (1984) delineate the degree of squeezing using the coefficient Nc which represents the ratio of the rock mass uniaxial compressive strength (UCS) to the in-situ stress and establish their approach for classification of degree of squeezing based on the Equation 5 and the criteria outlined in Table 3.


(5)
Where, σcm is rock mass uniaxial compressive strength; P0 is in-situ stress; γ is unit weight of rock mass; and H is tunnel overburden.
Aydan et al. (1993) a semi-empirical approach
Drawing from their experience with Japanese tunnels, Aydan et al. (1993) introduced a relationship between the strength of intact rock (σci) and the overburden rock pressure (γH), using the same equation as (5). This relationship assumes that the uniaxial compressive strength of the intact rock (σci) and that of the rock mass (σcm) are equivalent. Based on the data from surveyed tunnels in squeezing rock conditions in Japan, Aydan et al. (1993) reveals that squeezing conditions are likely to arise when the ratio σc/γH is less than 2.0.
Hoek and Marinos (2000) a semi-empirical approach
Hoek (1998) employed the ratio of the rock mass uniaxial compressive strength (σcm) to the in-situ stress (p0) to gauge the likelihood of tunnel squeezing issues. Hoek and Marinos (2000) further demonstrated that plotting tunnel strain εt against the ratio σcm/p0 offers an effective method for assessing tunnelling problems in the presence of squeezing conditions.
Hoek (2000), through axi-symmetric finite element analyses derived an approximate relationship for tunnel strain εt using Equation 6 and Equation 7 considering pi = 0.

Where, σcm is rock mass uniaxial compressive strength; σci is uniaxial compressive strength of the intact rock; mi is Hoek–Brown parameter for intact rock; GSI is Geological Strength Index; ε is tunnel strain (defined as the percentage ratio of radial tunnel wall displacement to tunnel radius); P0 is in situ stress; Pi is internal support pressures.
Drawing from the above analysis and examining case histories, Hoek (2000) presented the curve depicted in Figure 6 as an initial estimate for evaluating tunnel squeezing problems.
The result of the empirical and semi-empirical approaches considering geomechanical properties of tunnel route is illustrated in Table 4. As it is clear from the following results, the approaches developed mostly from the Himalayan region shows almost the same predictions for squeezing conditions in this project. The Hoek and Marinos (2000) approach was implemented to evaluate maximum deformation based on Equation 7 with the results shown in Table 4.

Deformation analysis of tunnel at tail shield
Carranza-Torres and Fairhurst (2000) determined that the Convergence Confinement Method (CCM) consists of three fundamental components: the Longitudinal Displacement Profile (LDP), the Ground Reaction Curve (GRC), and the Support Characteristics Curve (SCC).
As an initial approximation, ground reaction curves were generated based on the estimated geomechanical properties using Rocsupport software, employing Carranza-Torres' approach (2004). These curves were used to assess the maximum ground deformations that may occur up to the point of first support contact, which corresponds to the end of the tail shield at 9.85 meters.
TBMs becoming jammed in squeezing conditions arises when the available thrust is insufficient to maintain TBM progress or to facilitate a TBM restart, as indicated by Ramoni and Anagnostou (2011) and Zhao et al. (2012). To address this issue, one possible approach involves determining the closure of the TBM shield gap.

In the preliminary analysis utilizing Rocsupport, the maximum feasible deformation compared with the gaps between the TBM shield and the excavation diameter across various combinations of overcuts to assess the potential for TBM jamming in squeezing conditions. However, if these deformations surpass the prescribed limits, the point at which this gap closes concerning the tunnel face is determined using a Longitudinal Displacement Profile (LDP) plotting radial displacement against the distance from the tunnel face. Should the computed distance be less than or equal to the length of the TBM shield (9.85m), it signifies the development of a load buildup on the machine, which may lead to TBM jamming. In such cases, a more detailed analysis employing the Finite Element Method (FEM) is undertaken to assess and address the situation.

The LDP, computed using the semi-analytical approach outlined by Vlachopoulos and Diedrichs (2009), which offers a preliminary estimation of expected deformations, guides the identification of sections where FEM approaches may be required. The analysis will yield results in the form of a plastic radius (Rpl) and the maximum displacement at the tunnel perimeter (ur,max).
The comprehensive analysis results for all critical sections, as determined through the analytical method employing Rocsupport, are provided in Table 5. These results are presented as the maximum expected displacement at the end of the tail shield, the anticipated maximum tunnel convergence, and the plastic radius of the excavated tunnel at each critical section.
Based on the analysis above, there is no anticipation of the ground making contact with the shield in any of the sections. Consequently, no pressure buildup is expected, provided that suitable overcuts are implemented at the appropriate locations. It's worth noting that second section (chainage 49+440) represents the scenario with the most significant deformation and convergence.
Numerical analysis of deformations at tail shield

As stated, based on the analytical analysis, the most critical section will be at the chainage 49+440 which is further analysed using FEM (Plaxis) to further evaluate any squeezing risks.
The Axisymmetric finite element model provides more detailed results by incorporating the elasto-plastic behavior of the ground and accounting for the presence of the TBM shield and segmental lining. In FEM analysis, the initial stress is defined as the mean stress. Notably, the stepping of the shields has not been considered in this analysis, adopting a conservative approach. For all other sections not exhibiting squeezing issues according to analytical methods, control can be achieved through various overcuts, obviating the need for further refined analysis. It is also expected that in these sections, the ground will not come into contact with the TBM shields. Consequently, to drive the TBMs or initiate a restart, a nominal thrust force sufficient to overcome friction due to the machine's self-weight should suffice. The results of the FEM modelling are presented from Figure 7 to Figure 9.

The thrust required to overcome the friction force between the shield and the rock mass can be determined using Equation 8.
Fr =ps Sμ (8)
Where ps is the pressure acting on the shield, μ is the friction coefficient, and S is the contact surface area between the shield and the rock mass. The contact surface area of the shield and rock can be calculated as per Equation 9.
S=2πrs Lc (9)
Where rs signifies the shield radius, and Lc is the length at which contact takes place.
The friction coefficient is variable, typically falling within the range of 0.15 to 0.35 for sliding friction during TBM advancement and 0.25 to 0.45 for static friction during TBM restart.
Likewise, the analysis to ascertain the maximum thrust necessary for both sliding and restarting the TBMs, utilizing the equations described in Equation 8, was carried out, yielding the following results:
- Maximum thrust required for sliding: 47,500kN
- Maximum thrust required for TBM restart: 61,071kN
Since the calculated thrust forces are lower than the maximum nominal thrust force of the TBM, they are deemed acceptable.
Convergence measurement in TBM tunnelling
As mentioned, the machines are equipped with three void measurement cylinders along the shield, spaced at a distance equal to the advance length (1,700mm). These void measurements are conducted during TBM stoppages, both short stoppages (e.g., during ring building) and long stoppages (e.g., routine maintenance, probe drilling, tunnel conveyor extensions, etc.). The TBM operator measures the void behind the shield, recording this information along with the precise time and the shield's chainage in the data logger. These recorded data are used to assess the actual convergence around the TBM. Figure 10 displays the data obtained through the void measurement system at various chainages in the first 2.7km of the upline tunnel.

To account for tolerances in the advance length and to exclude incorrect records (resulting from not measuring the same location with the void measurement cylinders), records in which two readings have a tolerance greater than ±50mm in chainage are not considered in the ground convergence calculations. Ground convergence is derived from the readings of the void measurement system during TBM advancement and is presented in Figure 11, where GC1-2 represents the convergence measured by the first and second void measurement cylinders, and the same format applies to GC2-3 and GC1-3.

Furthermore, the Ground Convergence Rate is calculated considering the time between two measurements. Figure 12 illustrates the Ground Convergence Rates, in which GCR1-2 representing the rates obtained from the first and second void measurement cylinder data, and the same nomenclature applies to GCR2-3 and GCR1-3.

Additionally, as previously mentioned, planned stoppages occur during tunnel execution, with durations ranging from several hours to one or more days. During these stoppages, void measurements are conducted, and the data analysis is carried out, utilizing precise convergence measurements taken at a single point while eliminating abnormal data. This process ensures a pure and accurate assessment of the Ground Convergence Rate, as depicted in Figure 13.

The most critical section within the 2.7km length of the tunnel was situated between chainage 49+000 to 49+500, where the highest Ground Convergence Rate (GCR) was recorded. The ground closure around the shield in this specific section closely matched with the measurements derived from both the analytical and FEM analyses. Considering some convergences was attributed to wedge falls occurring on the tunnel crown, resulting in the recording of 250mm void behind the shield.
Conclusions
This comprehensive exploration of various approaches for assessing squeezing ground conditions, spanning empirical, semi-empirical, analytical, and numerical methods, has been discussed and their applications have been demonstrated within the context of the Rishikesh to Karnaprayag railway project, Package 4 (Tunnel 8). Notably, among the empirical and semi-empirical approaches, the Aydan et al. (1993) approach, based on a diverse dataset from different rock types and not confined to the same Himalayan region database, yielded distinctive results in the evaluation of squeezing conditions for this case study. Throughout these evaluations, it became evident that certain critical squeezing zones shared consistent outcomes across different methods, corroborated by FEM analysis. The most critical zone was identified around chainage 49+440, where site data were collected and meticulously assessed, employing state-of-the-art TBM technologies for monitoring tunnel convergence. In the initial 2.7km of the upline tunnel (spanning from chainage 48+180 to 50+880), the highest Ground Convergence Rate was observed in close proximity to the same chainage, as evaluated through empirical, semi-empirical, and analytical approaches. Furthermore, continuous data collection and evaluation within the project are essential for adapting actual Ground Convergence (GC) and Ground Convergence Rates (GCR) to the evolving rock conditions and TBM excavation parameters.
Acknowledgements
The authors express their heartfelt gratitude to Rail Vikas Nigam Limited as the project client, Larsen & Toubro as the project contractor, Herrenknecht as TBM supplier, and TUMAS-ALTINOK Joint venture as detailed design and project management consultant of the project for their invaluable support and collaborative efforts in providing a wealth of worthwhile and useful data. This data has been instrumental in commencing the journey of developing an approach to address squeezing conditions in TBM tunnelling in Himalaya.
References
- Aydan, O., Akagi, T. and Kawamoto, T. 1993. The squeezing potential of rocks around tunnels; theory and prediction. Rock Mechanics Rock Engineering, 26(2), pp 137-163.
- Barla, G. 1995. Squeezing rocks in tunnels. ISRM News Journal, 3/4, pp 44-49.
- Barla, G., Barla, M., Bonini, M., Debernardi, D., 2014. Guidelines for TBM tunnelling in squeezing conditions – a case study, Geotechnique Letters 4, 83–87,
- Barton, N., Lien, R. and Lunde, J. 1974. Engineering classification of rock masses for the design of rock support. Rock Mechanics, Vol. 6, pp 189-236.
- Carranza-Torres, C. and Fairhurst, C. 2000. Application of the convergence confinement method of tunnel design to rock masses that satisfy the Hoek-Brown failure criteria. Tunnelling and underground space Technology,15(2), pp 187-213.
- Carranza-Torres, C. 2003. Dimensionless graphical representation of the exact elastoplastic solution of a circular tunnel in a Mohr-Coulomb material subject to uniform far-field stresses. Rock Mechanics Rock Engineering, 36(3), pp 237-253.
- Goel, R. K., Jethwa U. L. and Paithakan, A.G. 1995. Tunnelling through young Himalayas - a case history of the Maneri - Uttarkashi power tunnel. Engng. Geol., 39, pp 31-44.
- Hoek, E. 1998. Tunnel support in weak rock, Keynote address, Symp. On sedimentary rock engineering, Taipei, Taiwan, 20–22.
- Hoek, E. and Marinos, P. 2000. Predicting tunnel squeezing problems in weak heterogeneous rock masses. Tunnels and Tunnelling International, part one-November 2000, pp 45-51; part two -December 2000, p 33-36.
- Jethwa, J.L., Singh, B. & Singh, B. 1984. Estimation of ultimate rock pressure for tunnel linings under squeezing rock conditions—a new approach. In Design and Performance of Underground Excavations: ISRM Symposium—Cambridge, UK, Thomas Telford Publishing, 231¬238.
- Ramoni, M. and Anagnostou, G. 2001. The interaction between shield, ground and tunnel support in TBM tunnelling through squeezing ground. Rock Mechanics and Rock Engineering. 44 (1), 2011, 37-61.
- Singh, B., Jethwa, J. L., Dube, A. K. and Singh, B. 1992. Correlation between observed support pressure and rock mass quality. Tunnelling and Underground Space Technology, 7, pp 59-74.
- Verman, M.K., 1993. Rock mass-tunnel support interaction analysis, Ph.D. Thesis, Indian Institute of Technology Roorkee, India.
- Vlachopoulos, N., Diederichs, M., 2009. Improved Longitudinal Displacement Profiles for Convergence Confinement Analysis of Deep Tunnels. Rock Mech Rock Eng 42, 131–146.
For more details please contact at:
E-mail: