Ready-Mixed Concrete Plant: Analysis of Sludge Formed
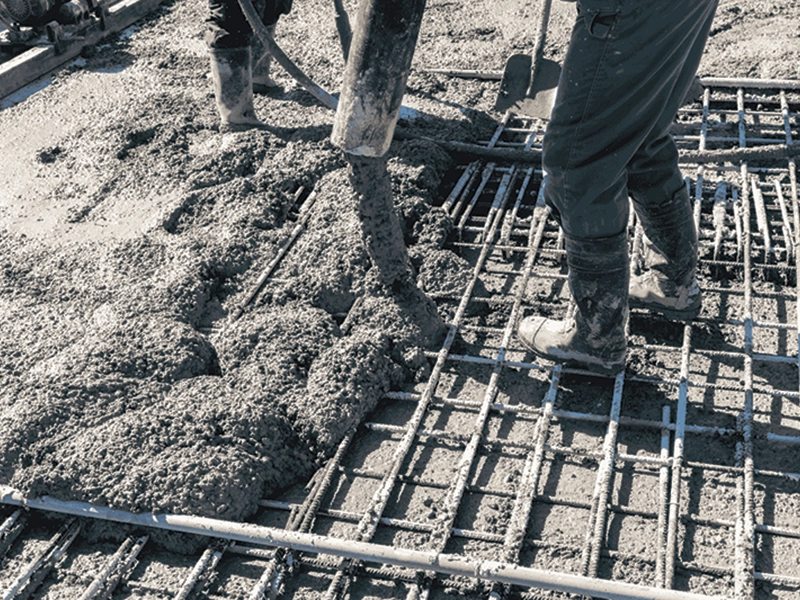
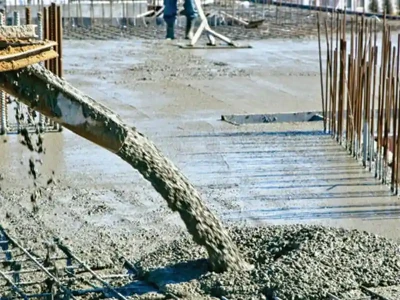
Ready-Mixed concrete is used in the civil engineering and construction business, for example: bridge, free way, dam and buildings. In Ready-Mix Concrete plant, concrete is produced at plant and it is delivered to site. Initial setting time of concrete is 30 minutes. To prolong the setting time, plasticizers are used in Ready-Mix Concrete. Pumpability and Flowability are the major issues in Ready-Mix Concrete; hence slump is the major criteria with the strength. A transit mixer takes approximately 45 to 180 minutes to deliver concrete and return to the site depending on the distance of site from the plant and other conditions. Some concrete particles/ slurry stick to the blades of transit mixer, walls and floor of the transit mixer which is normally termed as sludge in technical terms.
Prof Arjita Biswas
Asst Professsor,
Prof P.R Adavi
Professor, Civil Engineering Department, M.I.T Pune
Asst Professsor,
Prof P.R Adavi
Professor, Civil Engineering Department, M.I.T Pune
Introduction
Ready-Mixed concrete plant operations are large consumers of water. Sludge water is the waste wash water from concrete mixing plants and agitator trucks. Approximately 200 litres of water are used to produce one cubic meter of concrete from a central batch plant. The figure from a truck mix plant is higher, at 300 litres. In addition, approximately 500-1500 litres of water are used to wash down the plant and yard at the end of each production day, plus 100 litres to wash out each mixer - the central mixer and every truck used that day. With the growing demand for Ready-Mixed concrete, the disposal of sludge water is becoming an increasing environ- mental concern. Each working day, approximately 700–1300 litres of wash water are required for a single concrete Truck. Due to the large amount of suspended matter and high alkalinity untreated sludge water cannot be legally discharged into urban sewers. In general, the procedure for sludge water disposal utilizes two series-connected sedimentation basins. The first basin receives leftover concrete and wash water from the concrete plant and trucks. The overflow sludge water containing suspended fine particles is transferred to the second basin. After a settling period, the water from both basins is flushed to the municipal drains. Leftover concrete and sediment from the first basin and muddy sludge from the second basin are placed in a landfill.
The problem of Sludge is severe with:
The problem of Sludge is severe with:
- The older transit mixers
- More Detention time at site
- Failure of transit Mixer
- Climatic problem
- Severe traffic jam
- Any other unforeseen situation
As the time increases, setting are at a faster rate, slump reduces drastically and flowability reduces at a faster rate. It becomes more difficult to remove the settled/ sticked sludge formed in the transit mixer.
Approximately, 120-200 liters of water is used for cleaning of each transit mixture to remove the sludge from the blades of transit mixtures, wall and floor of the transit mixer.
Approximately, 120-200 liters of water is used for cleaning of each transit mixture to remove the sludge from the blades of transit mixtures, wall and floor of the transit mixer.
- To minimize the sludge formed during transportation of Ready-Mixed Concrete from Plant to site and Back.
- To minimize the water used during removal of sludge formed in transit mixer and for cleaning of transit mixer.
- To find out alternative solution for reutilization of sludge formed dur- ing transportation of Ready-Mixed Concrete and also from the fines coming out of Sediment tanks.
| Table no 1:Production of Concrete and Sludge Formation in the month of August | ||||||
| Date | Production in Cu.m in Aug | Sludge in Cu.m in Aug | Production in Cu.m in sep | Sludge in Cu.m in sep | Production in Cu.m in Oct | Sludge in Cu.m in Oct |
| 01 | 95 | 1.6 | 202 | 2.47 | 100 | 1.61 |
| 02 | 112 | 1.61 | 48 | 1.39 | 300 | 2.95 |
| 03 | 78 | 1.55 | 210 | 2.49 | 360 | 3.17 |
| 04 | 230 | 2.31 | 260 | 2.95 | 310 | 2.66 |
| 05 | 118 | 1.64 | 320 | 3.45 | 80 | 1.56 |
| 06 | 230 | 2.78 | 270 | 3 | 220 | 2.25 |
| 07 | 215 | 6 | 215 | 2.55 | 200 | 2.19 |
| 08 | 90 | 1.58 | 190 | 2.25 | 240 | 2.34 |
| 09 | 110 | 4.5 | 110 | 1.63 | 210 | 2.21 |
| 10 | 175 | 1.71 | 310 | 3.21 | 120 | 1.63 |
| 11 | 58 | 1.44 | 170 | 2.1 | 250 | 2.4 |
| 12 | 64 | 1.46 | 180 | 2.06 | 70 | 1.53 |
| 13 | 220 | 2.17 | 190 | 2.31 | 180 | 1.73 |
| 14 | 180 | 1.73 | 120 | 1.69 | 190 | 2.14 |
| 15 | 125 | 1.65 | 150 | 1.85 | 220 | 2.27 |
| 16 | 230 | 2.79 | 210 | 2.53 | 270 | 2.39 |
| 17 | 117 | 1.63 | 215 | 2.74 | 300 | 2.89 |
| 18 | 110 | 1.62 | 110 | 1.59 | 350 | 3.15 |
| 19 | 220 | 2.24 | 135 | 1.73 | 160 | 1.62 |
| 20 | 68 | 1.48 | 155 | 1.91 | 320 | 3 |
| 21 | 72 | 1.51 | 200 | 2.4 | 300 | 2.93 |
| 22 | 52 | 1.43 | 215 | 2.64 | 270 | 2.38 |
| 23 | 50 | 1.42 | 170 | 2.15 | 220 | 2.28 |
| 24 | 71 | 1.5 | 112 | 1.65 | 210 | 2.22 |
| 25 | 60 | 1.47 | 146 | 1.82 | 270 | 2.42 |
| 26 | 120 | 4.55 | 185 | 2.21 | 150 | 1.67 |
| 27 | 90 | 1.58 | 315 | 3.27 | 290 | 2.45 |
| 28 | 80 | 1.54 | 300 | 3.33 | 225 | 2.3 |
| 29 | 75 | 1.55 | 180 | 2.09 | 180 | 1.88 |
| 30 | 80 | 1.55 | 190 | 2.35 | 240 | 2.37 |
| Total | 6805 | 68.59 | 5783 | 81 | 6565 | 68.59 |
Scope of project
Analysis of data of daily production of ready-mixed concrete, sludge formed during the transportation of ready-mixed concrete form plant to site and back to the site, quantity of water used to wash the
 |
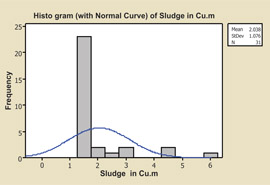 |
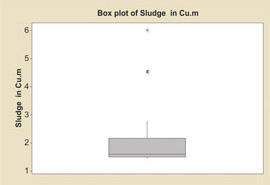
| Figure 1: Boxplot of sludge in Cu.m for Aug | Figure 2: Histogram of Sludge in Cu.m for Aug |
Production of Concrete and Sludge Formation in the Month of August
Daily production of concrete was recorded for the Plant for one month. The Concrete produced was of different grade but for simplicity, we have considered the total production per day ignoring the grade of concrete. Date wise production of sludge was also recorded for three months.
 |
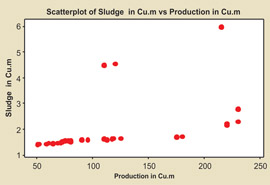 |
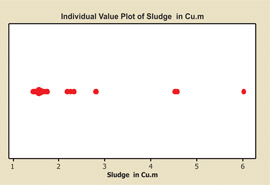
| Figure 3: Individual Value Plot of Sludge in Cu.m for Aug | Figure 4: Scatter plot of Sludge in Cu.m Vs Production in cu.m for Aug |
Statistical Analysis of Sludge
Regression Analysis: Sludge in Cu.m versus Production in Cu.m for Month of August.
The Regression Equation is : Sludge in Cu.m = 1.01 + 0.00866 Production in Cu.m
The Regression Equation is : Sludge in Cu.m = 1.01 + 0.00866 Production in Cu.m
Interpretation of Results
| Table no 2: Basic Descriptive statistics of Sludge for the month of August | |||||||||||
| Variable | Mean | SE Mean | St. Dev | Variance | Coef Var | Min | Max | Range | Median | Q1 | Q3 |
| Sludge in Cu.m | 2.038 | 0.193 | 1.076 | 1.159 | 52.81 | 1.42 | 6.0 | 4.58 | 1.6 | 1.51 | 2.17 |
| Table no 3: Regression Analysis | ||||
| Predictor | Coef | SE Coef | T | P |
| Constant | 1.0075 | 0.3842 | 2.62 | 0.014 |
| Production in Cu.m | 0.008661 | 0.002887 | 3.00 | 0.005 |
| Table no 4: Analysis of Variance | |||||
| Source | DF | SS | MS | F | P |
| Regression | 1 | 8.2340 | 8.2340 | 9.00 | 0.005 |
| Residual Error | 29 | 26.5302 | 0.9148 | ||
| Total | 30 | 34.7642 | |||
| Table no 5: Unusual Observations | ||||||
| Obs | Production in Cu.m | Sludge in Cu.m | Fit | SE Fit | Residual | St Resid |
| 7 | 215 | 6.000 | 2.870 | 0.326 | 3.130 | 3.48R |
| 9 | 110 | 4.500 | 1.960 | 0.174 | 2.540 | 2.70R |
| 26 | 120 | 4.500 | 2.047 | 0.172 | 2.503 | 2.66R |
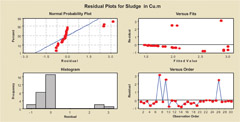 |
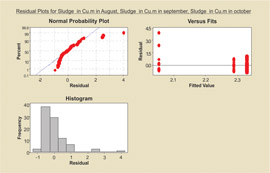
| Figure 5: Residual plots for sludge in cu.m for Month of Aug |
There are three outliners observation 7, 9 and 26 where Residual is more than the standard Residual indicating some special cause of variation.
Thus from this result, we understand that though there is correlation between the sludge produced and the Production of Ready-Mix Concrete other factors other than Production have to be considered for formation of sludge.
Analysis of Variance (ANOVA) of Sludge Production for the Month of August, September, and October
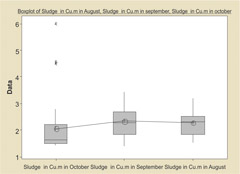 |
| Figure 6: Box plot of Sludge for Aug, Sept, Oct |
The ANOVA is based on the following assumptions:
- The treatment data must be normally distributed.
- The variance must be the same for all treatments.
- All samples are randomly selected.
- All the samples are independent.
Analysis of variance tests the null hypothesis that all the population means are equal at a significance level α:
The null hypothesis will be
H0 : µ1(Sludge in Cu.m in Aug ) = µ2 (Sludge in Cu.m in Sept) = µ3 (Sludge in Cu.m in Oct)
The Alternate hypothesis will be
Ha : µ1 (Sludge in Cu.m in Aug) '"µ2 (Sludge in Cu.m in Sept) '" µ3 (Sludge in Cu.m in Oct)
The null hypothesis will be
H0 : µ1(Sludge in Cu.m in Aug ) = µ2 (Sludge in Cu.m in Sept) = µ3 (Sludge in Cu.m in Oct)
The Alternate hypothesis will be
Ha : µ1 (Sludge in Cu.m in Aug) '"µ2 (Sludge in Cu.m in Sept) '" µ3 (Sludge in Cu.m in Oct)
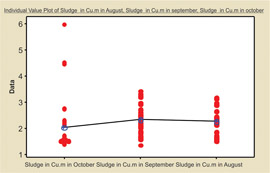 |
 |
| Figure 7: Indivual Value plot of sludge in cu.m | Figure 8: Residual Plot of sludge for Aug, Sept,Oct |
Interpretation of Results
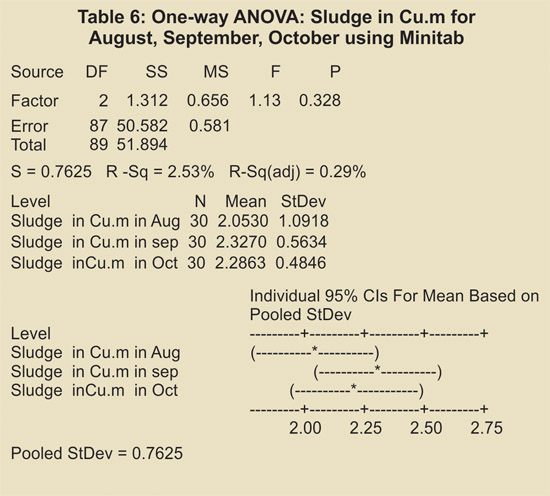
From Minitab we find F stat= 1.33, from F-table the critical value of F for α = 0.05 with the degrees of freedom n1=2 and n2=87 is 3.1. Because 3.1 is greater than 1.33, we cannot reject the null hypothesis. We conclude that there is not a statistically significant difference between the means of formation of sludge in Cu.m in the month of August, September and October i.e there is no variation in the formation of sludge with respect to time.
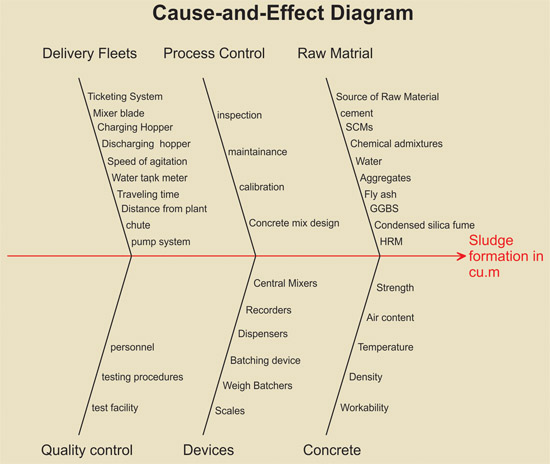
Cause and Effect Diagram
A Cause and effect Diagram was created to find out the causes of the formation of Sludge after brainstorming with the Quality Manager and the Project Manager. The following causes were found to be the reasons for the formation of sludge as shown in the diagram below. Each of the causes was investigated and scope of improvement was identified.
Conclusion
This study analysis on the formation of sludge in Ready-Mix Concrete plant. From we tries to find out the possible reasons for formation of Sludge. By using Regression analysis, we tries to find the correlation of formation of sludge and the production of Concrete. The regression analysis clearly shows that there is a correlation between the production of Concrete and formation of sludge.
By use of Analysis of variation we, tried to find out if the formation of sludge was seasonal. The study clearly showed that the formation of sludge was not seasonal i.e. there is not a statistically significant difference between the means of formation of sludge in Cu.m in the month of August, September and October i.e there is no variation in the formation of sludge with respect to time.
The cause and effect diagram helped us to identify the possible causes for formation of sludge and by studying each of the above process in depth, we would be able to improve each of the processes and how the improvement in processes could reduce formation of sludge.
References
- Seung Heon Han, Myung Jin Chae, keon Soon, Ho Dong Ryu (Jan 2008), Six Sigma Based Approach to improve performance in Construction Operations, Journal of management in Engineering, Vol-24(1), Pg 21- 31.
- Low Sui Pheng, Mok Sze Hui(Aug 2004), Implementing and Applying Six Sigma in Construction, Journal of Construction Engineering and Management, Vol.130(4), Pg 482-489.
- Frederick Buggie ( Aug 2000), Beyond Six Sigma, Journal of Management in Engineering, Vol -3, Pg 28- 31.
- T.M Kubaik and Donald W. Benbow(2010), The Certified Six Sigma Black belt handbook, Pearson Publication.
- Forrest. W. Breyfogle, (2003), Implementing Six Sigma, IInd Edition,John Wiley and Sons Publication.
- Peter Pande, Robert(2008), The SIX SIGMA WAY, Tata McGraw-hill Publishing Co.Ltd.
- Ahire, S., Landeros, R., Golhar, D.(2006), Total quality management: a literature review and an agenda for future research, Journal of Production and Operations Management, pg. 277-307.
- Sousa, R. Voss (2007), Quality management re-visited: a reflective review and agenda for future research, Journal of Operations Management, vol- 20, pg 91-109.
- Linderman, K., Schroeder, R., Zaheer, S., Choo( March 2006), Six Sigma: A goal theoretic perspective, Journal of Operations Management, vol. 21(2), pg. 193-203.
- Dean, J., Bowen (2006), Managing theory and total quality: improving research and practice through theory development, Academy of Management Review, vol. 19(3), pg. 392-418.
- Harry (May 2007), Six Sigma: A Breakthrough Strategy for Profitability and Quality Progress, Journal of management in Engineering, vol. 31(5), Pg. 60-62.
- Hahn, G., Hill, W., Hoerl, R., Zinkgraf , Aug 2005), The Impact of Six Sigma Improvement. A Glimpse Into the Future of Statistics, The American Statistici- an, vol. 53(3), Pg. 208-215.
- Oakland (2007), Total Quality Management, Butterworth-Heinemann, London
- Anderson, Sweeney, Williams (2006), Statistics for Business and Economics, Thomson Publication. Breyfogle (2008), Implementing Six Sigma: Smarter Solutions Using Statistical Methods, Wiley publication.
- Hahn, G., Doganaksoy (2003), Statistical tools for Six Sigma, McGraw-Hill, New York.
- IS 4926: 2003, Ready-Mixed Concrete-Code of Practice (Second Revision), Bureau of Indian Standards
- IS 456: 2000, Plain and Reinforced Concrete-Code of Practice ( Third Revision), Bureau of Indian Standards
- IS 516: 1959, Method of Test for Strength of Concrete, Bureau of Indian Standards
Published on:
06 December 2011
Published in: NBM&CW December 2011
Share:
We Value Your Comment