An Application of Operating Characteristic Curves in Online Strength Monitoring of Ready Mixed Concrete
Debasis Sarkar, Lecturer CPM, CEPT University Navrangpura, Ahmedabad, Dr. Manish Thaker, Lecturer in Statistics, Statistics Department M.G. Science Institute, Navrangpura, Ahmadabad.
The operating characteristic (OC) curves measure the performance of a sampling plan. This can be used to find out the producer’s risk and consumer’s risk. In context to commercial ready mixed concrete plants, the producer’s risk is associated with the risk of a good quality concrete being rejected by the client and the consumer’s risk is associated with the risk of accepting a poor quality concrete. Online quality monitoring deals with the monitoring techniques applied during the production of the ready mixed concrete in the RMC plants. 28 days cube compressive strength data of concrete grades have been collected from RMC plants in and around Ahmedabad and attempts have been made to investigate the producer’s risk and consumer’s riskwhich would enable RMC producers and consumers to assure quality levels.
Quality monitoring of ready mixed concrete (RMC) has to be carried out throughout its production process. There are various techniques for online monitoring of the concrete , namely (i) Control charts–Cusum Control charts, Schewart Control charts, EWMA Control charts (ii) Acceptance Sampling (iii) British Ready Mixed Concrete Association (BRMCA) concrete control system. However, if the RMC producers in our country adopts any of the above monitoring techniques, it would enable them to produce and sell quality product at reasonable prices. The operating characteristic curves which measure the performance of a sampling plan can be utilized for finding out the producer’s risk (associated with the risk of a good quality concrete being rejected by the client) and consumer’s risk (associated with the risk of accepting a poor quality concrete). In this paper, an attempt has been made to plot the OC curves for various grades of concrete collected from the RMC plants in and around Ahmedabad. The collected 28 days cube strength data for the various concrete grades produced by these RMC plants have been utilized in finding out the producer’s risk, average quality level, consumer’s risk and limiting quality level from the OC curves plotted. These parameters would provide adequate information about assuring the quality levels for RMC producers and consumers.
In acceptance sampling plans by attribute, a product item is classified as conforming or not, but the degree of conformance is not specified. In acceptance sampling plans by variable the quality characteristic is expressed as a numerical value.
Acceptance sampling can be used as a form of product inspection between companies and their customers, or between departments or divisions within the same company. It does not control or improve the quality level of the process. It is merely a method for determining the disposition of the lot. Acceptance sampling procedures will accept some lots and reject others, even though they are of same quality. There is a risk of rejecting “good” lots or accepting “poor“lots, identified as producer’s risk and consumer’s risk respectively.
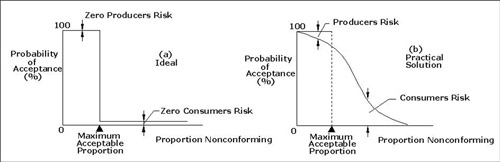
If the producer designs for 97.5% of concrete to be above the specified strength when the theoretical basis of the compliance rules is 95%, the risk of failing on any normal size of contract is acceptably low. By this approach the ready mixed concrete industry runs less risk problems with each individual small contract and also safeguards larger contracts and its overall production Thus the conventional way by which probabilities may be judged by both producer and consumer is through the use of the operating characteristic curve (Figure. 1.0). For any compliance clause, the producer may assess the risk of having complying concrete rejected (producer’s risk) and the consumer can assess the risk of accepting non-complying concrete (consumer’s risk). In the theoretical diagram (Figure. 1.0a), the producer’s risk and consumer’s risk are both nil. In practice, diagrams are usually of the form of Figure 1.0b where both run some risk.
Key elements of an OC curve are described as follows.
Producer’s risk (α) : This is a risk associated with rejecting a lot of “good” quality. It is generally denoted by "α" Since á is expressed in terms of the probability of non-acceptance, it cannot be located on an OC curve unless it is specified in terms of probability of acceptance. This conversion is given below:
Probability of acceptance (Pa) = 1 - α
Acceptable quality level (AQL): This is a numerical definition of a good lot, associated with the producer’s risk a. Thus AQL is a percent defective that is the base line requirement for the quality of the producer’s product. The producer would prefer the sampling plan to have a high probability of accepting a lot that has a defect level less than or equal to the AQL.
Consumer’s risk (β): This is a risk associated with accepting a lot of "poor" quality. It is generally denoted by "β)"
Limiting quality level (LQL): This is a numerical definition of a poor lot associated with consumer’s risk. Thus the LQL is a designated high defect level that would be unacceptable to the consumer. The consumer would prefer the sampling plan to have a low probability of accepting a lot with a defect level as high as the LQL.
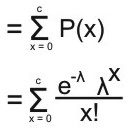
To construct an OC curve, we assume that the process produces a stream of lots and the lot size is large and the probability of non– conforming item is small. Poisson distribution can be used to find out the probability of "x" non - conforming items in the sample (n). This probability is given by:
P(x)= e-λ λx / x!
where x
= 0,1,2, ….. ∞
λ = Average number of non - conforming items in the sample.
= np (where n = sample size and p = proportion of non - conforming items)
The probability of lot acceptance can be found out by using:
Pa = P (x ≤ c) , here 'c' denotes the acceptance number.
 OC curve has the following properties:
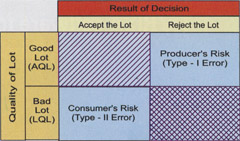
The above parameters can also be represented by the decision table Figure 3.0.
Conformity criteria for compressive strength (EN 206- 1:2000)
Conformity assessment shall be made on test results taken during a n assessment period that shall not exceed the last twelve months . Conformity is confirmed if both the criteria given in Table 1.0 for either initial or continuous production are satisfied.
Current compliance rules of BS 5328
The current strength compliance rules of BS 5328 are:
In this paper, an attempt has been made to apply clause BS 5328(ii) to the 28 days compressive strength results for M20 grade concrete, which has resulted in identification of the batches in which “good” quality concrete is being rejected by the client and the batches in which “poor” quality concrete is being accepted by the consumer. The details of this case is demonstrated in Table 3.0. A similar attempt will be made in future papers to understand the application of conformity criteria as per Table 1.0, Criterion 1 (EN- 206-1:2000).
Note: Criterion of acceptance is 20+3 = 23 Mpa for mean of four
For the batch 18-21, result no. 18 (23.20 Mpa), result no. 20 (24.50 Mpa) and result no. 21 (22.45 Mpa) inspite of being above the specified strength (20 Mpa) are being rejected during sampling as the other faulty results of the batch like result no. 19 (18.95 Mpa) together with the good results fail to satisfy the acceptance criteria. Inspite of these strengths being more than the specified strength, but during sampling these three results are being rejected. Thereby the producer has a risk of about three good samples out of a lot of thirty being rejected by the client along with poor quality samples. Thus the producer’s risk can be quantified as 10%. A similar logic can be applied for quantifying consumer’s risk. In the above case one poor sample i.e. result no. 19 (18.95 Mpa) is being accepted by the consumer along with other good samples for a lot of thirty. Thus the consumer’s risk can be quantified as 3.3%.
Similar analysis has been carried out for concrete grades M25, M30, and M40. A comparative statement showing the results of the analysis is represented here.
From the above Table, it has been observed that the producers risk for the RMC plant under study ranges between to 16.66% and the consumers risk is about 3.3%. An Operating characteristic curve (OC) has been plotted from the data available pertaining to the probability of acceptance (Pa) and proportion nonconforming (p). Poisson Distribution is applied for plotting the OC curve for a reasonably large sample size (n) and small proportion nonconforming (p). The acc eptance number (c) is assumed to be 0 for this analysis. Lot acceptance probabilities for different values of proportion nonconforming for sampling plan n = 30, and c = 0 is analyzed in the Table 5.
A plot of Probability of acceptance (Pa) versus Proportion nonconforming (p) for the values obtained from Table 5.0 for concrete grade M20 produces the graph as represented in Figure. 4.0. The values of the producers risk and consumers risk obtained from the analysis of Table 3.0 are represented as comparative statement in Table 4.0. These values of the producers risk and consumers risk can be superimposed on the OC curve to find out the Acceptable quality level (AQL) and Limiting quality level (LQL) for the concrete grade under analysis (M20). Similar analysis can be carried out for concrete grades M25, M30, and M40.
As per Figure. 4.0 and Table 4.0 for M20 grade concrete lot with 10% defectives will be accepted only 3.3 % of times by the consumer (with probability of 0.033). With á = 0.1 the value of AQL obtained from the Figure. 4.0 is 0.0041. Thus with AQL = 0.76% and 1- α= 0.90 lot with 0.76% defectives should then be accepted only 90% of times. Similar analysis for concrete grades M25, M30, and M40 is represented in the Table 6.0.
As per Table 6.0 analysis of grade of concrete M25 resulted in an ideal situation where the producers risk and consumers risk is zero. Thus the probability of acceptance is 100%. For M30 grade lot with 16.6% defectives will be accepted only 3.3% times by the consumer. For α = 0.166 (16.6%) the AQL obtained from graph (Figure. 4.0) is 0.0076. Thus 1 - α = 0.834, which indicates that lot with 0.76% defectives should then be accepted only 83.4% of times. Analysis of M40 concrete projects a case where a lot with 0.41% defectives had 90% probability of acceptance. The consumers risk α) being nil, the LQL tends to 1.00. Thus a lot with 100% defectives has 0% probability of acceptance. The above analysis of various grades of concrete indicate that the RMC plant operators have a general tendency to reduce the producers risk by following a mix design where the Target Mean Strength (TMS) is obtained from the equation TMS = fck + 2o where fck is 28 days characteristic compressive strength and = Plant Standard Deviation. The design margin is kept as 2o for a confidence level of 97.5%. However, too m u c h overconservative mix design will lead to an uneconomical mix thereby resulting in higher price per cum. of concrete for various grades. A representation of the OC curve by considering the parameters Probability of acceptance Vs Percent within limits (%) is shown in Figure. 5.0.
As per Figure. 5.0 and as per analysis (Table: 7.0) it is suggested that the RMC producers can fix up the AQL = 97.5% which will keep the producers risk (β) within 5% and LQL = 0% which will also restrict the consumers risk (®) within 5%. Thus fixing up the AQL and LQL to the above mentioned limits will develop a practical situation where the chances of a good concrete being rejected by the client and chances of the consumer to accept bad concrete are both restricted to 5%. This criteria can be taken care of during the mix design of the concrete grades.
The operating characteristic (OC) curves measure the performance of a sampling plan. This can be used to find out the producer’s risk and consumer’s risk. In context to commercial ready mixed concrete plants, the producer’s risk is associated with the risk of a good quality concrete being rejected by the client and the consumer’s risk is associated with the risk of accepting a poor quality concrete. Online quality monitoring deals with the monitoring techniques applied during the production of the ready mixed concrete in the RMC plants. 28 days cube compressive strength data of concrete grades have been collected from RMC plants in and around Ahmedabad and attempts have been made to investigate the producer’s risk and consumer’s riskwhich would enable RMC producers and consumers to assure quality levels.
Quality monitoring of ready mixed concrete (RMC) has to be carried out throughout its production process. There are various techniques for online monitoring of the concrete , namely (i) Control charts–Cusum Control charts, Schewart Control charts, EWMA Control charts (ii) Acceptance Sampling (iii) British Ready Mixed Concrete Association (BRMCA) concrete control system. However, if the RMC producers in our country adopts any of the above monitoring techniques, it would enable them to produce and sell quality product at reasonable prices. The operating characteristic curves which measure the performance of a sampling plan can be utilized for finding out the producer’s risk (associated with the risk of a good quality concrete being rejected by the client) and consumer’s risk (associated with the risk of accepting a poor quality concrete). In this paper, an attempt has been made to plot the OC curves for various grades of concrete collected from the RMC plants in and around Ahmedabad. The collected 28 days cube strength data for the various concrete grades produced by these RMC plants have been utilized in finding out the producer’s risk, average quality level, consumer’s risk and limiting quality level from the OC curves plotted. These parameters would provide adequate information about assuring the quality levels for RMC producers and consumers.
Acceptance Sampling Plan
Acceptance sampling is the type of inspection procedure employed when inspection is for the purpose of acceptance or rejection of a product based on adherence to a standard.In acceptance sampling plans by attribute, a product item is classified as conforming or not, but the degree of conformance is not specified. In acceptance sampling plans by variable the quality characteristic is expressed as a numerical value.
Acceptance sampling can be used as a form of product inspection between companies and their customers, or between departments or divisions within the same company. It does not control or improve the quality level of the process. It is merely a method for determining the disposition of the lot. Acceptance sampling procedures will accept some lots and reject others, even though they are of same quality. There is a risk of rejecting “good” lots or accepting “poor“lots, identified as producer’s risk and consumer’s risk respectively.
Operating Characteristic Curve
Operating characteristic (OC) curve measures the performance of an accepting sampling plan. This curve plots the probability of accepting the lot versus proportion non–conforming. Thus, the OC curve displays the discriminatory power of the sampling plan and it shows the probability that a lot submitted with a certain fraction defective will be either accepted or rejected.If the producer designs for 97.5% of concrete to be above the specified strength when the theoretical basis of the compliance rules is 95%, the risk of failing on any normal size of contract is acceptably low. By this approach the ready mixed concrete industry runs less risk problems with each individual small contract and also safeguards larger contracts and its overall production Thus the conventional way by which probabilities may be judged by both producer and consumer is through the use of the operating characteristic curve (Figure. 1.0). For any compliance clause, the producer may assess the risk of having complying concrete rejected (producer’s risk) and the consumer can assess the risk of accepting non-complying concrete (consumer’s risk). In the theoretical diagram (Figure. 1.0a), the producer’s risk and consumer’s risk are both nil. In practice, diagrams are usually of the form of Figure 1.0b where both run some risk.
Fig: 1.0 Operating characteristic curves. (a) Ideal (b) Practical solution
Key elements of an OC curve are described as follows.
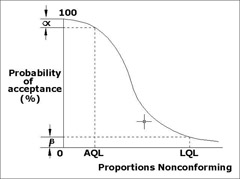
Fig 2.0: OC curve showing
(AQL , 1 - α) and (LQL , β)
(AQL , 1 - α) and (LQL , β)
Probability of acceptance (Pa) = 1 - α
Acceptable quality level (AQL): This is a numerical definition of a good lot, associated with the producer’s risk a. Thus AQL is a percent defective that is the base line requirement for the quality of the producer’s product. The producer would prefer the sampling plan to have a high probability of accepting a lot that has a defect level less than or equal to the AQL.
Consumer’s risk (β): This is a risk associated with accepting a lot of "poor" quality. It is generally denoted by "β)"
Limiting quality level (LQL): This is a numerical definition of a poor lot associated with consumer’s risk. Thus the LQL is a designated high defect level that would be unacceptable to the consumer. The consumer would prefer the sampling plan to have a low probability of accepting a lot with a defect level as high as the LQL.
To construct an OC curve, we assume that the process produces a stream of lots and the lot size is large and the probability of non– conforming item is small. Poisson distribution can be used to find out the probability of "x" non - conforming items in the sample (n). This probability is given by:
P(x)= e-λ λx / x!
where x
= 0,1,2, ….. ∞
λ = Average number of non - conforming items in the sample.
= np (where n = sample size and p = proportion of non - conforming items)
The probability of lot acceptance can be found out by using:
Pa = P (x ≤ c) , here 'c' denotes the acceptance number.
- OC curve in general is continuous in nature
- When P = 0 ⇒ Pa = 1 ie. lots with no defectives must always be accepted
- When P = 1, ⇒ Pa = 0, ie. lots with all defectives must always be rejected. Probability of acceptance of lots with few defectives can be identified from the OC curve plotted for that particular case.
All OC curves passes through points (0,1) and (1,0) - As P increases Pa decreases and vice- versa
- The points on the OC curve are ( LQL, 1 - α) , ( AQL, β) where a denotes producer’s risk. and b denotes consumer’s risk.
Fig. 3.0 Decision Table defining producers risk and consumers risk of a lot.
Conformity criteria for compressive strength (EN 206- 1:2000)
Conformity assessment shall be made on test results taken during a n assessment period that shall not exceed the last twelve months . Conformity is confirmed if both the criteria given in Table 1.0 for either initial or continuous production are satisfied.
| Table : 1.0 : Conformity criteria for compressive strength | |||
| Production | Number n of test results for compressive strength in the group | Criterion 1 | Criterion 2 |
| Mean of n results (fcm) N / mm2 | Any individual test result (fci) N / mm2 | ||
| Initial | 3 | ≥ fck + 4 | ≥ fck - 4 |
| Continuous |
Not less than 15 |
≥ fck + 1.48 σ | ≥ fck - 4 |
Current compliance rules of BS 5328
The current strength compliance rules of BS 5328 are:
- No result for a batch shall be less than the specified strength less 3 Mpa.
- No mean of four consecutive results shall be less than the specified strength plus 3 Mpa.
Data Collection and Case Study
Data in form of 28 days cube compressive strength results available for a number of grades of concrete, the corresponding mix proportions followed by the RMC plant operating around Ahmedabad were collected. About twenty samples for grade of concrete M20, and about thirty samples for grades M25, M30, M40 have been considered for the analysis of OC curves.| Table 2.0 : Compressive strength data for various concrete grades | |
| Concrete grade | Average 28 days compressive strength ( Mpa) |
| M20 | 35.50, 27.80, 35.80, 30.10, 27.60, 32.45, 30.20, 26.85, 31.10, 19.20, 25.86, 31.20, 25.60, 31.15, 35.80 27.50, 28.73, 23.20, 18.95, 24.50, 22.45, 29.80, 35.65, 30.80, 24.01, 25.25, 27.55, 30.15, 24.50, 22.60 |
| M25 | 31.20, 35.86, 31.00, 39.01, 35.60, 38.00, 29.68, 27.26, 30.88, 35.50, 28.88, 38.50, 27.60, 26.00, 37.10, 30.80, 34.45, 38.00, 33.51,35.80, 31.20, 36.52, 29.82, 37.80, 35.01, 36.60, 32.25, 31.50, 28.65, 27.55 |
| M30 | 40.00, 38.30, 45.32, 39.01, 43.50, 44.80, 36.25, 42.20, 30.00,39.70, 36.65, 37.25, 34.00, 29.15, 30.50, 35.30, 29.80, 34.50, 14.20, 45.50, 40.10, 38.20, 37.30, 39.50, 40.10, 42.20, 40.50, 39.80, 38.65, 40.20 |
| M40 | 48.55, 44.50, 56.10, 47.45, 52.50, 51.45, 46.75, 48.85, 53.30, 51.40, 55.65, 52.43, 46.82, 41.03, 41.05, 45.50, 39.90, 39.45, 47.84, 50.15, 52.23, 49.10, 46.63, 48.73, 55.63, 53.70, 45.63, 44.85, 48.80, 47.31 |
In this paper, an attempt has been made to apply clause BS 5328(ii) to the 28 days compressive strength results for M20 grade concrete, which has resulted in identification of the batches in which “good” quality concrete is being rejected by the client and the batches in which “poor” quality concrete is being accepted by the consumer. The details of this case is demonstrated in Table 3.0. A similar attempt will be made in future papers to understand the application of conformity criteria as per Table 1.0, Criterion 1 (EN- 206-1:2000).
| Table 3.0 : Application of BS 5328 clause (ii) "mean of four" to successive results for grade M20 concrete | ||||
| Cube no. | Av. 28 days compressive strength (Mpa) | Mean of four | Accept concrete represented by | Reject concrete represented by |
| 1 | 35.50 | - | - | - |
| 2 | 27.80 | - | - | - |
| 3 | 35.80 | - | - | - |
| 4 | 30.10 | 32.30 | 1 - 4 | - |
| 5 | 27.60 | 30.33 | 2 - 5 | - |
| 6 | 32.45 | 31.49 | 3 - 6 | - |
| 7 | 30.20 | 30.01 | 4 - 7 | - |
| 8 | 26.85 | 29.28 | 5 - 8 | - |
| 9 | 31.10 | 30.15 | 6 - 9 | - |
| 10 | 19.20 | 26.84 | 7 - 10 | - |
| 11 | 25.86 | 25.75 | 8 -11 | - |
| 12 | 31.20 | 26.84 | 9 -12 | - |
| 13 | 25.60 | 25.47 | 10 -13 | - |
| 14 | 31.15 | 28.45 | 11 - 14 | - |
| 15 | 35.80 | 30.93 | 12 - 15 | - |
| 16 | 27.50 | 30.01 | 13 - 16 | - |
| 17 | 28.73 | 30.79 | 14 - 17 | - |
| 18 | 23.20 | 28.81 | 15 - 18 | - |
| 19 | 18.95 | 24.59 | 16 - 19 | - |
| 20 | 24.50 | 23.84 | 17 - 20 | - |
| 21 | 22.45 | 22.28 | - | 18 - 21 |
| 22 | 29.80 | 23.93 | 19 - 22 | - |
| 23 | 35.65 | 28.10 | 20 - 23 | - |
| 24 | 30.80 | 29.68 | 21 - 24 | - |
| 25 | 24.01 | 30.07 | 22 - 25 | - |
| 26 | 25.25 | 28.93 | 23 - 26 | - |
| 27 | 27.55 | 26.90 | 24 - 27 | - |
| 28 | 30.15 | 26.74 | 25 - 28 | - |
| 29 | 24.50 | 26.86 | 26 - 29 | - |
| 30 | 22.60 | 26.20 | 27 - 30 | - |
Note: Criterion of acceptance is 20+3 = 23 Mpa for mean of four
For the batch 18-21, result no. 18 (23.20 Mpa), result no. 20 (24.50 Mpa) and result no. 21 (22.45 Mpa) inspite of being above the specified strength (20 Mpa) are being rejected during sampling as the other faulty results of the batch like result no. 19 (18.95 Mpa) together with the good results fail to satisfy the acceptance criteria. Inspite of these strengths being more than the specified strength, but during sampling these three results are being rejected. Thereby the producer has a risk of about three good samples out of a lot of thirty being rejected by the client along with poor quality samples. Thus the producer’s risk can be quantified as 10%. A similar logic can be applied for quantifying consumer’s risk. In the above case one poor sample i.e. result no. 19 (18.95 Mpa) is being accepted by the consumer along with other good samples for a lot of thirty. Thus the consumer’s risk can be quantified as 3.3%.
Similar analysis has been carried out for concrete grades M25, M30, and M40. A comparative statement showing the results of the analysis is represented here.
| Table 4.0 : Finding out producer’s risk and consumer’s risk for various concrete grades. | ||||||
| Grade of Concrete |
Number of results more than specified strength in rejected lot | Percentage (%) |
Producers risk (α) (%) | Number of results less than specified strength in accepted lot | Consumers Risk (β) (%) | |
| Number | Number | Percentage (%) | ||||
| M20 | 03 | 10 | 10 | 01 | 3.3 | 3.3 |
| M25 | 00 | 00 | 00 | 00 | 00 | 00 |
| M30 | 05 | 16.66 | 16.66 | 01 | 3.3 | 3.3 |
| M40 | 03 | 10 | 10 | 00 | 00 | 00 |
From the above Table, it has been observed that the producers risk for the RMC plant under study ranges between to 16.66% and the consumers risk is about 3.3%. An Operating characteristic curve (OC) has been plotted from the data available pertaining to the probability of acceptance (Pa) and proportion nonconforming (p). Poisson Distribution is applied for plotting the OC curve for a reasonably large sample size (n) and small proportion nonconforming (p). The acc eptance number (c) is assumed to be 0 for this analysis. Lot acceptance probabilities for different values of proportion nonconforming for sampling plan n = 30, and c = 0 is analyzed in the Table 5.
| Table 5.0 : Lot acceptance probabilities for different values of proportion nonconforming for sampling plan n = 30 , c = 0. | ||
| Proportion nonconforming (p) | np = λ | Probability of lot acceptance (Pa) (From Cumulative Poisson Distribution Table as per Appendix 1) |
| 0.00 | 0.0 | 1.0 |
| 0.005 | 0.15 | 0.861 |
| 0.01 | 0.30 | 0.740 |
| 0.02 | 0.60 | 0.548 |
| 0.03 | 0.90 | 0.406 |
| 0.04 | 1.20 | 0.301 |
| 0.05 | 1.50 | 0.223 |
| 0.06 | 1.80 | 0.165 |
| 0.07 | 2.10 | 0.122 |
| 0.08 | 2.40 | 0.090 |
| 0.09 | 2.70 | 0.067 |
| 0.10 | 3.00 | 0.049 |
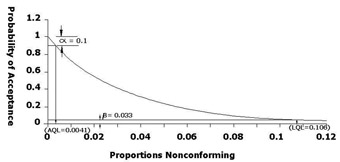
Fig 4.0: OC curve for M20 Grade Concrete
As per Figure. 4.0 and Table 4.0 for M20 grade concrete lot with 10% defectives will be accepted only 3.3 % of times by the consumer (with probability of 0.033). With á = 0.1 the value of AQL obtained from the Figure. 4.0 is 0.0041. Thus with AQL = 0.76% and 1- α= 0.90 lot with 0.76% defectives should then be accepted only 90% of times. Similar analysis for concrete grades M25, M30, and M40 is represented in the Table 6.0.
| Table 6.0 : Comparative analysis of producer’s risk, consumer’s risk, acceptable quality level, limiting quality level for various concrete grades. | ||||
| Grade of concrete | Producer’s risk (α) | Consumer’s risk (β) | Acceptable Quality level(AQL) | Limiting Quality level (LQL) |
| M20 | 0.10 | 0.033 | 0.0041 | 0.106 |
| M25 | 0.00 | 0.00 | 0.00 | 1.00 |
| M30 | 0.166 | 0.033 | 0.0076 | 0.106 |
| M40 | 0.10 | 0.00 | 0.0041 | 1.00 |
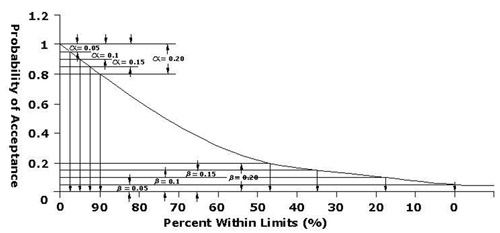
As per Table 6.0 analysis of grade of concrete M25 resulted in an ideal situation where the producers risk and consumers risk is zero. Thus the probability of acceptance is 100%. For M30 grade lot with 16.6% defectives will be accepted only 3.3% times by the consumer. For α = 0.166 (16.6%) the AQL obtained from graph (Figure. 4.0) is 0.0076. Thus 1 - α = 0.834, which indicates that lot with 0.76% defectives should then be accepted only 83.4% of times. Analysis of M40 concrete projects a case where a lot with 0.41% defectives had 90% probability of acceptance. The consumers risk α) being nil, the LQL tends to 1.00. Thus a lot with 100% defectives has 0% probability of acceptance. The above analysis of various grades of concrete indicate that the RMC plant operators have a general tendency to reduce the producers risk by following a mix design where the Target Mean Strength (TMS) is obtained from the equation TMS = fck + 2o where fck is 28 days characteristic compressive strength and = Plant Standard Deviation. The design margin is kept as 2o for a confidence level of 97.5%. However, too m u c h overconservative mix design will lead to an uneconomical mix thereby resulting in higher price per cum. of concrete for various grades. A representation of the OC curve by considering the parameters Probability of acceptance Vs Percent within limits (%) is shown in Figure. 5.0.
Fig. 5.0: Ideal limits of α , β , AQL and LQL for concrete grades M20, M25, M30, M40
As per Figure. 5.0 and as per analysis (Table: 7.0) it is suggested that the RMC producers can fix up the AQL = 97.5% which will keep the producers risk (β) within 5% and LQL = 0% which will also restrict the consumers risk (®) within 5%. Thus fixing up the AQL and LQL to the above mentioned limits will develop a practical situation where the chances of a good concrete being rejected by the client and chances of the consumer to accept bad concrete are both restricted to 5%. This criteria can be taken care of during the mix design of the concrete grades.
| Table 7.0 : Generalized values of α, β, AQL and LQL for concrete grades M20, M25, M30 , M40. | |||
| Producers risk (α) | Acceptable quality level (AQL) % | Consumers risk(β) | Limiting quality level (LQL) % |
| 0.05 | 97.5 | 0.05 | 0 |
| 0.10 | 95 | 0.10 | 17.5 |
| 0.15 | 91.5 | 0.15 | 35 |
| 0.20 | 90 | 0.20 | 47 |
Limitations
The major disadvantage of this type of OC curve is that there are no provisions for the AQL and LQL in the input parameters of the Poisson Distribution. In this case, the only input parameters are the sample size (n), acceptance number (c), and proportion nonconforming (p). Also it is not reasonable to assume that the distribution will be the same for any given RMC plant. But when AQL and LQL are specified, it is reasonable to assume that the distribution will vary based on these two limits. In addition to this weakness, it is not reasonable to assume a proportion of nonconforming units of any lot for given RMC producer is unique throughout its production process. In real practice each lot might have different proportion of nonconforming items, which is timated from each lot data.Conclusions
The OC curve is a widely accepted tool to quantify the producers risk and consumers risk. Sampling plans with large sample sizes are better able to discriminate between acceptable and unacceptable quality. Therefore, fewer lots of unacceptable quality are accepted and fewer lots of acceptable quality are rejected. As per the analysis done in this paper, it is suggested that the RMC producers ideally maintains the Acceptable quality level (AQL) = 97.5% and Limiting quality level (LQL) = 0%, which will restrict the producers risk and consumers risk to 5%. This will also ensure that unnecessarily there is no requirement of over conservative mix design for the concrete grades which will definitely make the grade prices more economical. Thus a good compliance scheme should ensure that the producers risk and consumers risk are at an acceptable level and are properly distributed between the producer and the consumer. Here lies the importance of OC curves which can be used to evaluate the desired compliance scheme.References
- Neville, A.M. and Brooks, J.J. Concrete Technology ELBS with Longman, 1994.
- Dewar, J.D. and Anderson, R. Manual of Ready Mixed Concrete Blakie and Son Ltd, Glasgow and London, 1988.
- Miller, I and Freund, J.E. Probability and Statistics for Engineers Pearson Education (Singapore) Pte. Ltd., 2001.
- Mitra, A. Fundamentals of quality control and improvement Pearson Education (Singapore) Pte. Ltd.,2004.
- Montgomery, D.C. Introduction to Statistical Quality Control John Wiley & Sons, Inc. 1985. Indian standard code of practice for plain and reinforced concrete, IS 456: 2000, Bureau of Indian Standard, New Delhi.
| APPENDIX 1 : Cumulative Poisson Distribution | ||||||||
| λ | ||||||||
| x | 0.01 | 0.05 | 0.10 | 0.20 | 0.30 | 0.40 | 0.50 | 0.60 |
| 0 | 0.990 | 0.951 | 0.904 | 0.818 | 0.704 | 0.670 | 0.606 | 0.548 |
| 1 | 0.999 | 0.998 | 0.995 | 0.982 | 0.963 | 0.938 | 0.909 | 0.878 |
| 2 | 0.999 | 0.999 | 0.998 | 0.996 | 0.992 | 0.985 | 0.976 | |
| λ | ||||||||
| x | 0.70 | 0.80 | 0.90 | 1.00 | 1.10 | 1.20 | 1.30 | 1.40 |
| 0 | 0.496 | 0.449 | 0.406 | 0.367 | 0.332 | 0.301 | 0.272 | 0.246 |
| 1 | 0.844 | 0.808 | 0.772 | 0.735 | 0.699 | 0.662 | 0.626 | 0.591 |
| 2 | 0.965 | 0.952 | 0.937 | 0.919 | 0.900 | 0.879 | 0.857 | 0.833 |
| λ | ||||||||
| x | 1.50 | 1.60 | 1.70 | 1.80 | 1.90 | 2.00 | 2.10 | 2.20 |
| 0 | 0.223 | 0.201 | 0.182 | 0.165 | 0.149 | 0.135 | 0.122 | 0.110 |
| 1 | 0.557 | 0.524 | 0.493 | 0.462 | 0.433 | 0.406 | 0.379 | 0.354 |
| 2 | 0.808 | 0.783 | 0.757 | 0.730 | 0.703 | 0.676 | 0.649 | 0.622 |
| λ | ||||||||
| x | 2.30 | 2.40 | 2.50 | 2.60 | 2.70 | 2.80 | 2.90 | 3.00 |
| 0 | 0.100 | 0.090 | 0.082 | 0.074 | 0.067 | 0.060 | 0.055 | 0.049 |
| 1 | 0.330 | 0.308 | 0.287 | 0.267 | 0.248 | 0.231 | 0.214 | 0.199 |
| 2 | 0.596 | 0.569 | 0.543 | 0.518 | 0.493 | 0.469 | 0.445 | 0.423 |
| λ | ||||||||
| x | 3.50 | 4.00 | 4.50 | 5.00 | 5.50 | 6.00 | 6.50 | 7.00 |
| 0 | 0.030 | 0.018 | 0.011 | 0.006 | 0.004 | 0.002 | 0.001 | 0.000 |
| 1 | 0.135 | 0.091 | 0.061 | 0.040 | 0.026 | 0.017 | 0.011 | 0.007 |
| 2 | 0.320 | 0.238 | 0.173 | 0.124 | 0.088 | 0.061 | 0.043 | 0.029 |
| ( Adapted from Introduction to Statistical Quality Control , Douglas C. Montgomery, Appendix I pp. 498 – 499 ) | ||||||||
Published on:
08 January 2009
Published in: NBM&CW June 2007
Share:
We Value Your Comment