Modeling of Stress–Strain Response of Fiber Reinforced Concrete
Prabhat Kumar, Retd. Scientist, Central Building Research Institute and P.C. Sharma, Retd. Head Material Sciences, Structural Engineering Research Centre, Ghaziabad
Addition of fiber reinforcement in mortar and concrete provides a large number of benefits. The mathematical modeling of this new material is needed to exploit its benefits to fullest extent. This paper brings past and present trends to achieve this. A compact mathematical model is presented and the process of calibration of model is demonstrated. Results are encouraging.
Introduction
Safety and economy are major concerns in building construction. The existing structures support safety aspects of the past and current design practices. However, economy and rationality aspects require continuous research in view of the advancements in material technology and more ambitious functional requirements of new structures. For example, high strength concrete (HSC) offers economic advantage in concrete filled tube columns, core walls, lower storey columns and pre–cast piles. Addition of silica fumes for strength enhancement makes HSC brittle. The economic advantage of HSC is partly off set on account of increased susceptibility to structural damage under abnormal operational conditions, which arise during natural disasters like earthquake and cyclone. Fibers may be added to HSC to compensate for the negative effect of silica fumes [1]. This product is fiber reinforced concrete (FRC). The addition of fibers marginally affects pre–peak stress–strain response of concrete, however, the post–peak response changes substantially (See Figure 1).
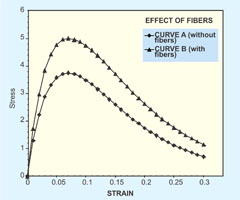 |
| Figure 1: Typical effects of fiber addition to concrete |
- Compressive strength increases
- Peak strain increases
- The rate of drop of post–peak descending branch moderates
- Stress at large strain enhances substantially
Recent revolution in the digital computer hardware and software technology places tremendous computation power at the disposal of an analyst. It must be gainfully utilized in the design of structures such as pavement and runways in particular. At present, the material technology appears to be moving faster than the corresponding analytical developments [4–7]. This article presents recent developments in the analytical modeling of FRC. The possibilities which still remain are described and future extensions are proposed. Availability of a satisfactory mathematical model can promote greater utilization of benefits obtained by adding fiber to concrete and also enhance areas of application.
Mechanics of Fiber Reinforcement of Concrete
There are a large number of variables in the problem of FRC.- Strength of the matrix to be reinforced,
- Material of fibers–It may be steel, glass or polypropylene,
- Aspect ratio of fibers l/f where l is length and f is diameter,
- End profile of fibers–hooked, bent or straight,
- Body profile of fibers–It may be twisted to improve bonding.
- Amount of fiber. Volume fraction Vf and weight fraction wf define the amount of fibers. These are related as in Equation 1. The ratio of unit weights is approximately 3.25 for steel fiber.
wf = (Unit weight of fiber material/Unit weight of matrix) Vf (1)
The area under the stress–strain curve is taken as a measure of deformation energy absorbing capacity of a material. The toughness ratio (TR) is defined as the ratio of area under the actual stress–strain curve to the area under an ideal rigid plastic material of similar strength. A toughness index (TI) is also defined as the ratio of toughness of fiber reinforced matrix to that of the un–reinforced matrix. It may be seen that TR is always less than unity while TI is always greater than unity. An integration of Equation of stress–strain curve is required to calculate toughness index. Ductility, on the other hand, is the ability of the material to deform without failure. The shape and rate of decay of descending branch of stress–strain curve characterize ductility property of a material. Toughness and ductility properties are important when loading involves impact, repetition and reversal.
It has been found [6] that everything being equal, the improvement due to fiber addition was relatively more pronounced in lower matrix compressive strengths. To facilitate further mathematical development, reinforcing index (RI) has been introduced. Experimental observations revealed [6] that higher RI resulted in smaller the slope of the post–peak branch of stress–strain curve. Therefore, the area under the stress–strain curve increased. RI can be defined with respect to volume fraction Vf as (VRI = Vf l/Φ) as well as with respect to weight fraction as (WRI = wf l/Φ). These two shall be related as in Equation 1. It was found [6] that VRI in excess of 2.0 resulted in deterioration rather than enhancement of properties. It indicates that there is an optimum benefit that can be derived from fiber addition. This may occur due to difficulty in ensuring uniform distribution of fibers in the body of concrete element.
Mathematical Modeling of FRC
In the derivation of analytical expression for stress–strain curve of FRC, following expressions are most commonly used.
A, B, C and D in Equation 2 are parameters which are determined from the boundary conditions at origin, peak point, inflexion point and at any other suitable location. The number of boundary conditions must be equal to the number of parameters. This mathematical fact limits the number of parameters which can occur in a general expression. A mathematical model is meaningless unless all its parameters can be characterized from the measurable quantities. In this presentation stress and strain are denoted by f and ε, respectively. Further, Y = fc/fP, X = εc/εP. Subscript P applies at peak point while c is a general point. Following studies highlight the difficulties in arriving at a suitable expression for stress–strain curve of FRC.
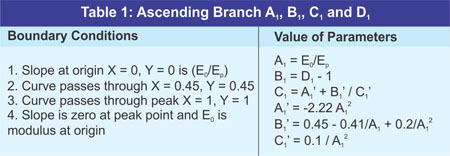
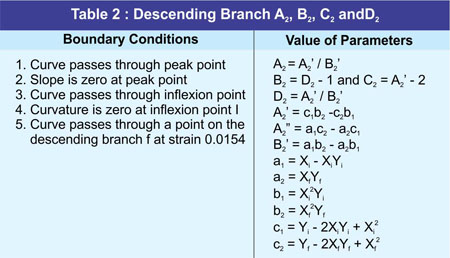
Fanella and Naaman [6] described properties of FRC through Equations [3–5]. Starting with the first expression of Equation 2 values for parameters A to D are as given in Tables 1 and 2.
fcf'= 1.9 RI + fc' --------------------------------(3)
Ecf= 162 fcf'+ 8270 ----------------------------(4)
εP= 0.00079RI + 0.0041 (fcf'/ fc') --------------(5)
Mebarkia and Vipulanandan [3] used second expression of Equation 2 as Equation 3.
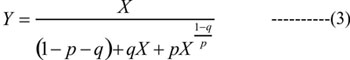
This expression satisfies the boundary conditions that it passes through origin and peak point. The following additional boundary conditions were used to determine parameters p and q (1) At origin initial tangent modulus is Eo/Ep(2) Slope is zero at peak point. Parameters p and q must meet the followings additional conditions p + q > 0; p + q 0. Through regression analysis with the experimental observations, the following model was produced. Xf and XP are fiber and polymer contents by weight, respectively. An integration of Equation 3 is required to calculate toughness index.
q = 1 – p – Ep/ Eo and
p = A + BXf+ CXf2 -------------(4)
Where,
A = – 0.36 + 0.076XP– 0.0029XP2
B = 0.46 – 0.068XP+ 0.0023XP2
C= 0.0055 + 0.0013XP– 0.000070XP2
Ezeldine and Balaguru [1] also used second expression of Equation 2 as Equation 5. One should note that Equations 3 and 5 are identical [â = (1–q)/p]. This model was calibrated for hooked as well as straight fibers with reinforcing index by weigh as RI and ri, respectively.
Hooked fibers:
β = 1.093 + 0.074*10-4Eo and
Eo= 9.610*104[RI]-0.926
Straight fibers:
β = 1.093 + 7.4818 [ri]-1.387
Mansur et al [8] used second expression of Equation 2 in his study. Equation 6 was used for the descending branch of stress–strain curve. The ascending branch used k1= 1 and k2= 1. This experimental program used hooked steel fibers.
For confined non–fiber concrete, k1= 2.77(ρsfy/fo) and k2= 2.19 (ρsfy/fo ) + 0.17
For confined fiber concrete, k1= 3.33 (ρsfy/fo ) + 0.12 and k2= 1.62 (ρsfy/fo ) + 0.35
Here ρs is the volumetric ratio of lateral ties, fy is proof stress of lateral ties and fo is unconfined strength of concrete.
Complete details of above mathematical models of FRC can be found in the original papers. The presentation of this section shows that analytical modeling of FRC is important and that use of empirical techniques is rampant in this endeavor. Also, the available analytical models are complicated and suffer on account of limited validity. More research effort is obviously required.
Recent Developments
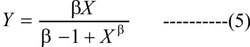
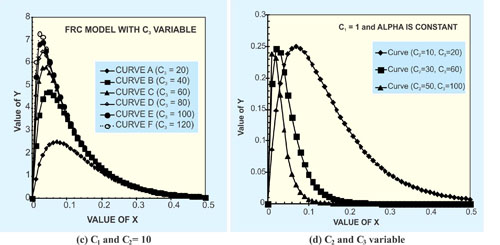
Barr and Lee [8] deviated from the prevailing trend of using either of the expressions given in Equation 2 to propose use of a double exponential model. In this approach, two exponential functions are subtracted to obtain proper shape of the stress–strain curve. Smith and Young [9] first used exponential function for this purpose (Equation 7). The double–exponential model uses Equation 8. This double–exponential model can be further developed by assigning values to parameters C1, C2 and C3 from the boundary conditions of FRC problem.Y = X EXP(1 – X) ----------------------------(7)
Y = C1[EXP(–C2X) – EXP(–C3X)] -----------(8)
 |
| Figure 2: Results of parametric study (continued) |
 |
| Figure 2: Results of parametric study (concluded) |
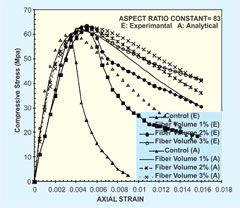
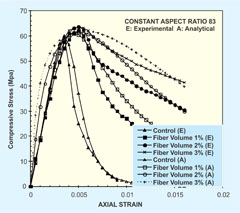
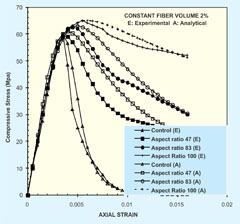
The first exponential function dominates the tail end where as the second expression influences the shape of stress–strain curve in the initial part. A parametric study of Equation 8 (Figure 2) shows that different combination of parameters yields a family of stress–strain curves. It should be possible to use this formulation for mathematical modeling of stress–strain behavior of FRC. This model is applied to the published experimental data on steel fibers [6]. The experimental and analytical results are compared in Figures 3 and 4.
 |
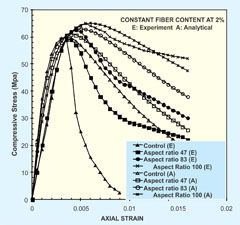 |
|
| Figure 3: Modeling of FRC with constant aspect ratio | Figure 4: Modeling of FRC with constant volume fraction |
Compact model [10] is also available in which the analytical line is made to pass through a point located on the tail of stress–strain curve. Equations 9 to 12 describe this model.
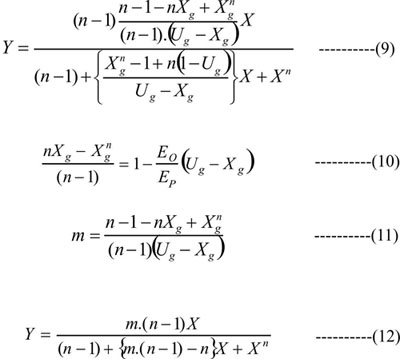
Equation 9 is the stress–strain relation in which solution of Equation 10 provides the value of exponent n. Equation 9 is obtained from Equation 12 in which value of m is as given in Equation 11. This model is also tried and the tail end point is taken at strain of 0.015. This model is applied to the published experimental data on steel fibers [6]. The experimental and analytical results are compared in Figures 5 and 6.
 |
 |
|
| Figure 5: Modeling of FRC with constant aspect ratio | Figure 6: Modeling of FRC with constant volume fraction |
X and Y are non-dimensional strain and stress, respectively; n = Model Parameter; m is a derived quantity (equation 11); U is a derived quantity (Xg/Yg). Subscript g denotes general point; O defines quantity at origin; and P applies to quantity at peak point. The application of compact model is more satisfactory than the double exponential model.
Conclusion
Stress–strain behavior of Fiber Reinforced Concrete is analytically modeled in this paper. Two published analytical models, which were never applied in modeling of FRC, have been used in the present study. Some difficulties were faced in the process. First of all, it was difficult to read the values of experimental observations from the published documents. Secondly, the exact conditions of experimental investigations were not known.Practically all experimental investigators propose an analytical model which applies very well to their data. It is not surprising because, the analytical models are based on the regression analysis of their own data.This paper considers data of other investigators, so this effort is unique. The effort of analytical modeling reported in this paper is very encouraging. This procedure shall be refined further and shall be reported in subsequent publications on this topic. More experimental data must be generated. For example, all varieties of fibers must be considered. The analytical procedure should then be applied to this more extensive experimental data to develop general expressions for toughness index etc. The proposed models are more suitable for analytical treatment like integration etc.
References
- Ezeldine, A. S. and Balaguru, P. N. (1992) "Normal and high strength fiber reinforced concrete under compression," Journal of Materials in Civil Engineering (ASCE), V. 4(4), pp. 415–429.
- Barrett, S. and McGreath, D. R. (1995) "Shotcrete support design in blocky ground," Tunneling and Underground Space Technology, V. 10(1), pp. 79–89.
- Mabarkia, S. and Vipulanandan, C. (1992) "Compressive behavior of glass fiber reinforced mortar," J of Materials in Civil Engineering (ASCE), V. 4(1), pp. 91–105.
- Shah, S. P. and Naaman, A. E. (1976) "Mechanical properties of glass and steel fiber reinforced mortar," ACI Journal, V. 73(1), pp. 50 – 53.
- Hughes, B. P. and Fattuhi, N. I. (1977) "Stress–strain curves for fiber reinforced concrete in compression," Cement and Concrete research, V. 7(2), pp. 173–183.
- Fanella, D. A. and Naaman, A. E. (1985) "Stress–strain properties of fiber reinforced mortar in compression," ACI Journal, V. 82(4), pp. 475–483.
- Mansur, M. A., Chin, M. S. and Wee, T. H. (1997) "Stress–strain relationship of confined high strength plain and fiber concrete," Journal of Materials in Civil Engineering (ASCE), 9(4), pp. 171–178.
- Barr, B. and Lee, M. K., (2003) "Modeling the strain softening behavior of plain concrete using a double–exponential model," Magazine of Concrete research, 55 (4), pp. 343–353.
- Smith, G. M. and Young, L. E. (1956) "Ultimate Flexural Analysis Based on Stress–Strain Curve of Cylinder." ACI Journal, Proc. V. 53 (6), pp. 597–609.
- Kumar, P. (2004) A compact analytical model for unconfined concrete under uni axial compression. Materials and Structures (RILEM), V. 37(9), pp. 585–590.
Published on:
15 April 2009
Published in: NBM&CW April 2009
Share:
We Value Your Comment