Economic Design of CUSUM Control Charts for Indian RMC Industry
Debasis Sarkar, Assistant Professor, Construction and Project Management Dept, CEPT University, Ahmedabad and Prof. Goutam Dutta, Productions and Quantitative Methods Area, Indian Institute of Management, Ahmedabad
The design of a control chart has economic consequences, in which the costs of sampling and testing, costs associated with investigating out of control signals and possibly correcting assignable causes, are all affected by the choice of the control chart parameters. Henceforth, it is logical to consider the design of a control chart from an economic viewpoint. In this paper, we made an attempt to develop an optimum economic model for CUSUM control charts applicable to Indian RMC industry.
Introduction
History reveals that Ready Mixed Concrete (RMC) was patented in Germany in 1903, but the means of transporting it had not developed sufficiently well to enable the concept to be exploited. In India, RMC was launched about two decades ago. Lack of proper manuals, higher initial costs than conventional site mixed concrete, high initial investments for installation of automatic batching plants and also lack of awareness were the major causes that led to an initial setback to the RMC industry. Thus in course of time awareness of the advantages of using RMC and realization of the fact that the conventional concrete may result in higher lifecycle cost due to higher maintenance costs made the construction industry to adopt RMC as a better option economically and qualitatively. But still in India only about 2% of the total cement produced is utilized in RMC production against 70% of the cement produced being utilized in RMC in UK and US.Control charts can effectively improve the efficiency of the production process of RMC. CUSUM (Cumulative Sum) control charts along with V-mask can be applied to RMC industry as a daily/weekly quality monitoring tool. The design parameters of CUSUM control chart (sample size, sampling frequency and control limits) can be chosen from an economic view point, and an optimum economic model can be developed which can predict the expected production cost per cum. of RMC.
Economic Design Philosophy
To formulate an economic model for the design of a control chart, it is necessary to make certain assumptions about the behavior of the process. These assumptions are as follows:- The process is assumed to be characterized by a single in- control state.
- The process transitions between states are instantaneous.
- The process is not self- correcting, which indicated that once a transition to an out of control state has occurred, the process can be returned to the in control condition only by management intervention following an appropriate out of control signal on the control chart. In some cases, however transitions between out of control states are allowed, provided the transitions are always consistent with further quality deterioration.
Cost Parameters
Generally, three categories of costs are considered in the economic design of control charts. These categories are as follows:- Costs of sampling and testing
- Costs associated with the investigation of an out of control signal and with repair or correction of any assignable cause found.
- Costs associated with production of nonconforming items
We assume:
- E (T) = Expected length (long term average length / mean length) of a cycle
- E (C) = Expected total cost incurred during the cycle
- E (A) = Expected cost per unit time
- E (A) = E (C) / E (T) ......... (1)
Literature Survey
Control charts are widely used to establish and maintain statistical control of a process. They are also effective devices for estimating process parameters, particularly in process capability studies. The use of control chart requires selection of a sample size, a sampling frequency or interval between the samples and the control limits for the chart. Selection of these three parameters is usually called the design of the control chart. The design of a control chart has economic consequences, in that the costs of sampling and testing, costs associated with investigating out of control signals and possibly correcting assignable causes, and costs of allowing nonconforming units to reach the consumer are all affected by the choice of the control chart parameters. Therefore, it is logical to consider the design of a control chart from an economic viewpoint. In recent years, considerable research has been devoted to this problem.Duncan (1956, 1971), Taylor (1967, 1968), Goel (1968), Lorenzen and Vance (1986), were the principal researchers who developed optimal economic models of control charts. Duncan (1956) proposed an economic model for the optimum economic design of the X-bar control chart. His work was the first to deal with a fully economic model of a Shewhart type of control chart, and to incorporate formal optimization methodology into the control chart parameters. Duncan's paper was the stimulus for much of the subsequent research in this area. Taylor (1968) was the first to investigate the economic design of CUSUM control charts. His model expresses the expected cost per unit of time as a function of the sample size, sampling interval and the V-mask design parameters. He assumes that a single assignable cause of specified magnitude occurs according to a Poisson process. To solve the model, however he assumes that the sample size and sampling interval are specified.
Goel (1968) has compared economically optimal X-bar and CUSUM charts. He reports that, in general, there is little difference between the two types of charts, with respect to optimum system cost. However, if a smaller than optimum sample size is used, the resulting economic penalties are more severe for the X-bar chart. Futhermore, the CUSUM chart is not quiet as sensitive to errors in specifying the magnitude of the shift as is the X-bar chart.
Ohta et al. (2002) proposed an economic model for the selection of time-varying control chart parameters for monitoring on-line the mean and variance of a normally distributed quality characteristic. The process is subject to two independent assignable causes. One cause changes the process mean and the other changes the variance. The occurrence times of these assignable causes are described by Weibull distributions having increasing failure rates. Yu and Wu (2004), Yu and Chen (2005) are of the view that most of the studies on the economic design of charts focuses on a fixed sampling interval (FSI), however it has been discovered that variable sampling interval (VSI) control charts are substantially quicker in detecting shifts in the process than FSI control charts due to higher frequency in the sampling rate when a sampling statistic shows some indication of a process change. The results of a numerical example adopted from an actual case indicate that the loss cost of VSI moving average control charts is consistently lower than that of the FSI scheme.
Reviewing the available literature of about past two decades we observed that, though substantial work has been carried out to develop economic design models in process and automation industry, but very minimal attempt has been made to develop economic design models applicable to construction industry. Furthermore, we believe that no attempt has been made to develop an optimum economic model for CUSUM control charts applicable to ready mixed concrete industry. In this paper we made an attempt to develop an optimum economic model for CUSUM control charts applicable to Indian RMC industry.
Optimum Economic Model of Cusum Control Chart
Lorenzen and Vance Economic Control Chart Model (Montgomery, 1985) popularly known as the LV model is one of the most widely accepted models for economic and optimum design of CUSUM control charts. This LV model provides the practitioner the most flexibility amongst any of the single assignable cause models available. By using average run lengths instead of Type I and Type II errors, LV allows the analyst to choose from any type of variable or attribute control chart. The LV model incorporates three types of cost ratios into its formulation. These are as follows:- The cost of producing non conforming items
- The cost of false alarms and of search and repair of the true assignable cause
- The cost of sampling
- Sample size (n)
- Sampling interval (h)
- Control interval width
The variables used in the model are defined as follows:
- γ0= Number of assignable causes per hour
- T = Expected time of occurrence of the assignable cause (a function of γ0)
- S = Expected number of samples taken while process is in-control (a function of γ0)
- T0= Expected search time when false alarm
- T1= Expected time to discover the assignable cause
- T2= Expected time to repair the process
- E = Time to sample and chart one item
- C = Production cost per hour
- C0 = Quality cost per hour while producing in- control
- C1= Quality Cost per hour while producing out of control
- W = Cost for search / repairs
- a = Fixed cost per sample
- b = Variable cost per unit
- Y = Cost per false alarm
- = Mean shift (number of standard deviation slip when out of control)
- n = Sample size
- h = Hours between samples or sampling interval
- K = CUSUM reference value
- H = CUSUM decision interval
- δ1= Flag for whether production continues during searches (1- yes, 0 – no)
- δ2= Flag for whether production continues during repairs (1-yes, 0- no)
- ARL1 = In-control average run length
- ARL2 = Out of control average run length
- ECT = Expected Cycle Time (time between successive in control periods)
- C = { C0/ γ0+ C1( - T + n E + h (ARL2) + δ1T1+ δ2T2) } / ECT + {( S Y / ARL1) +W } / ECT + { [ (a + bn) / h] [ 1 / γ0– T + n E + h (ARL2) + δ1T1 + δ2T2] } / ECT …… (2)
- ECT = 1 / γ0+ [(1 - δ1)S T0] / ARL 1 – T + nE + h (ARL2) + T1+T2
Proposed Optimum Economic Design of Cusum Control Chart Model for Indian RMC Industry
Considering the conditions existing in India an Optimum Economic Design CUSUM Control Chart Model applicable to Indian RMC industry is proposed. As per the basic operations of a typical Indian commercial RMC plant it is convenient to calculate the operation and production cost per m3 of concrete produced. This cost depends on the grade of concrete produced and may vary within a certain range from plant to plant depending upon the location of the plant and the source of raw materials. The parameters of this model are chosen to minimize the expected cost of production / m3 of concrete.The variables modified as per the proposed model are defined as follows:
- C = Expected cost of production / m3 of concrete
- C0= Quality cost / m3 while producing in-control situation
- C1= Quality cost / m3 while producing in out of control situation
- a = Fixed cost / m3
- b = Variable cost / m3
- h = Sampling interval (typically 1 sample of three cubes per batch of concrete)
- δ1= Flag for whether production continues during searches (1- yes, 0 – no)
- δ2= Flag for whether production continues during repairs (1-yes, 0- no)
- E = Time to sample and chart one item (minutes)
- T1= Expected time to discover the assignable cause (minutes)
- T2= Expected time to repair the process (minutes)
- ARL2 = Out of control average run length
- ECT = Expected Cycle Time (minutes)
- C = {C0+ C1 (n E + h (ARL2) + δ1T1+ δ2T2} / ECT + (a + b n) / ECT …….. (3)
Case Study and Testing of the Proposed Model
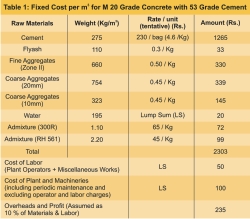
This proposed model as per equation was tested with data of is a fully computerized and commercial batching plant from Delhi. The production capacity of this plant is 60 m3 / hr and each batch is of capacity 2 m3. The cycle time for each batch is about 2 minutes where time taken to load the raw materials is about 1.5 minutes and mixing time is 0.5 minute.Thus for M20 grade concrete with 53 grade cement the fixed cost and variable cost per m3 of concrete as per data of year 2007 is calculated as follows:
(a) Fixed Cost
Total Fixed Cost = Rs. 2688 m3(b) Variable Cost
This includes cost of repairs and replacement of parts during major or minor machinery breakdown which can be taken as lump sum amount of Rs. 150 / m3 of concrete.(c) Quality Costs
Costs of quality primarily consist of the costs which are involved during production of concrete in, in-control and out of control situation. These are presented in tableModel Input data
- a = Rs. 2688 / m3
- b = Rs. 150 / m3
- C0= Rs. 90 / m3
- C1= Rs. 130 /m3
- h = 2 minutes
- n = 1
- δ1= 1
- δ2= 0
- E = 1 minute
- T1 = 1 minute
- T2= 1 minute
- ARL 2 = 10
- ECT = 2 minutes
- C = {C0+ C1 (n E + h (ARL 2) + δ1T1 + δ2T2} / ECT + (a + b n) / ECT
- = {90 + 130[(1 (1) + 2 (10) + 1(1) + 0(1)]} / 2 + {2688 + 150(1)}/2
- = 2894
- = Rs. 2894/m3
Limitations and Concluding Remarks
As per the results obtained from tests conducted on the Optimum Economic Design Model, it appears that for M 20 grade concrete in Delhi (Gurgaon) region as per the rates of materials and labor collected in year 2007, the expected total production cost (including overheads & profit) will be about Rs. 2894 / m3 of concrete. The RMC producers can fix the grade prices accordingly. The present grade prices charged by most of the RMC producers are much higher than Rs. 2894 / m3 for M20 grade. The increased production cost appears to be due to use of over conservative mix design and lack of systematic and judicious quality controlling and monitoring system. Also the production cost is increased due to unnecessary usage of more cement, than that specified, to reduce the producers' risk. Similar methodology can be applied for calculating the production costs of other grades of concrete like M25, M30, M35, M40, M50 and the like.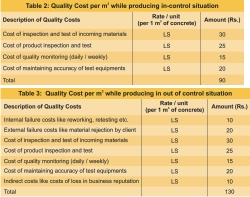
References
- Barnard, G.A. (1959) "Control Charts and Stochastic Process" Journal of Royal Statistical Society, Vol.21, pp.239 – 271
- Box, G. (1994) "Role of Statistics in Quality and Productivity Improvement" Journal of the Royal Statistical Society, Series A, Part 2, pp. 209-229
- Brown, B.V. (1984) "Monitoring Concrete by the CUSUM System" Concrete Society Digest No.6, Concrete Society, London.
- Chiu, W.K. (1974) "The Economic Design of Cusum Charts for Controlling Normal Means" Applications in Statistics, Vol. 23, pp. 420 – 433
- Deming, W.E. (1986) Out of Crisis, Massachusetts Institute of Technology, Center for Advanced Engineering Study, Cambridge, Massachusetts
- Dewar, J.D. and Anderson, R. (1988) Manual of Ready Mixed Concrete Blackie and Son Ltd., Glasgow and London.
- Duncan, A.J. (1956) "The Economic Design of X-bar Charts Used to Maintain Current Control of a Process" Journal of the American Statistical Association, Vol 51, pp 56-62
- Duncan, A.J. (1971) "The Economic Design of X-bar Charts When there is a Multiplicity of Assignable Causes" Journal of the American Statistical Association, Vol 66, pp 85- 91
- Ewan, W.D. (1963) "When and How to Use Cu-Sum Charts" Technometrics, Vol. 5, pp. 1 – 22
- Gan, F.F. (1991) "An optimal design of CUSUM quality control charts." Journal of Quality Technology, Vol. 23, pp. 279-286
- Goel, A.L. (1968) "A Comparative and Economic Investigation of X-bar and Cumultive Sum Control Charts" Ph.D Dissertation, University of Wisconsin-Madison, Wisconsin
- Goel, A.L. and Wu, S.M. (1973) "Economically Optimum Design of CUSUM Charts" Management Science, Vol. 19, pp. 1271 – 1282
- Grant, E.L. and Leavenworth, S. (2000) Statistical Quality Control, Seventh Edition, Tata McGraw Hill Publishing Co. Ltd., Delhi
- Johnson N.L. and Leone, F.C. (1962 a) "Cumulative Sum Control Charts–Mathematical Principles Applied to their Construction and Use" Industrial Quality Control, Vol. 18, pp.15 – 21
- Keats, J.B. and Montgomery, D.C. [Editors](1996) Statistical Applications in Process Control Marcel Dekker, Inc., New York.
- Kemp, K.W. (1961) "The Average Run Length of the Cumulative Sum Control Chart When a V-Mask is Used" Journal of the Royal Society, Series B, Vol. 23, pp.149 – 153
- Lorenzen, T.J. and Vance, L.C.(1986) "The Economic Design of Control Charts : A Unified Approach" Technometrics, Vol.28, pp.3 – 10
- Lucas, J.M. (1976) "The Design and Use of V-Mask Control Schemes" Journal of Quality Technology, Vol. 8, pp 1 – 12
- Montgomery, D.C. (1985), Introduction to Statistical Quality Control John Wiley & Sons, Inc, New York.
- Montgomery, D.C. (1980) "The Economic Design of Control Charts: A Review and Literature Survey" Journal of Quality Technology, Vol. 12, pp.75 – 87
- Montgomery D.C. and Woodall, W.H. (1997)" A Discussion on Statistically Based Process Monitoring and Control." Journal of Quality Technology Vol. 29, pp. 121-162
- Ohta, H., Kimura, A. and Rahim, A. (2002) An Economic Model for X bar and R charts with Time Varying Parameters. Quality and Reliability Engineering International, Vol. 18 (2), pp. 131-139
- Page, E.S. (1954) "Continuous Inspection Schemes" Biometric, Vol. 41, pp.100 – 115
- Page, E.S. (1961) "Cumulative Sum Control Charts" Technometrics Vol. 3, pp. 1 – 9
- Sarkar, D. and Bhattacharjee, B. (2003) "Quality Monitoring of Ready Mixed Concrete Using Cusum System" Indian Concrete Journal, Vol 7, pp. 1060-1065
- Taylor, H.M.(1968) "The Economic Design of Cumulative Sum Control Charts" Technometrics, Vol. 10, pp. 479 – 488
- Woodall, W.H. (1986) "The design of CUSUM quality control charts". Journal of Quality Technology, Vol. 18, pp. 99-102
- Woodall, W.H.(1985) "The Statistical Design of Quality Control Charts" The Statistician, Vol. 34, pp.155 – 160
- Yu , F.J. and Chen , Y.S. (2005) "An Economic Design for Variable Sampling Interval X bar Control Chart for a Continuous Flow Process." The International Journal of Advanced Manufacturing Technology, Vol. 25(3 - 4), pp.370 - 376
- Yu , F.J. and Wu , H.H. (2004) "An Economic Design for Variable Sampling Interval MA Control Charts". The International Journal of Advanced Manufacturing Technology, Vol. 24(1-2), pp.41-47
Published on:
11 June 2009
Published in: NBM&CW June 2009
Share:
We Value Your Comment