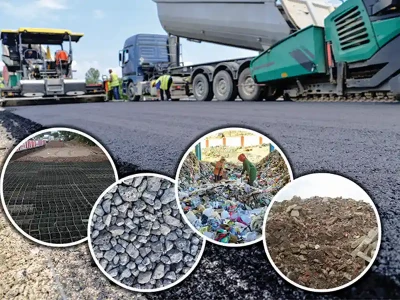
Reinforced earth retaining wall is comparatively a new construction technique. Due to its simplicity, economy and faster pace of construction, several such retaining walls have been constructed all over the world and this technique has almost replaced the conventional reinforced concrete and gravity retaining walls. To reduce the congestion on National Highway-2 at the crossing of Kalindi Kunj near Sarita Vihar, New Delhi, a flyover was constructed along Badarpur-Ashram direction. The construction of approach road was carried out with reinforced retaining wall with friction polymeric ties (geosynthetic material) as reinforcement material. Instead of conventional earth, pond ash from the nearby Badarpur thermal power plant was used as backfill material. The paper discusses the properties of geosynthetic reinforcement ; backfill material, design details and the methodology adopted for construction of reinforced approach embankment. Conclusions have been drawn about the suitability of geosynthetic material as a reinforcement and pond ash as a backfill material for the retaining wall.
Vasant G Havanagi, Principal Scientist
Anil Kumar Sinha, Scientist and Sudhir Mathur, Chief Scientist and Head (GTE), Central Road Research Institute, New Delhi.
In the present study, vertical retaining walls are built along the approaches of a flyover using geosynthetic material as reinforcement. The technique known as ‘Reinforced earth technique’ which not only saves the costly available land but also helps to decongest the intersection area. The paper discusses the utility of geosynthetics in the form of ‘friction ties’ as a reinforcement material. Pond ash was also investigated for its suitability as a backfill material instead of conventional earth.
Backfill
Pond ash was used as a back fill material for the construction of reinforced earth retaining wall and abutment as per British Standard BS 8006-1995 ‘Code of Practice for Strengthened/Reinforced Soils and Other Fills’. Pond ash was procured from the Badarpur thermal power plant, New Delhi and was investigated for its geotechnical characteristics in the laboratory. Pond ash is a non plastic coarse grained material. The angle value for angle of internal friction varied in the range of 32°-34°. Therefore, there is a possibility of development of interfacial friction between the backfill and the reinforcement. It has high coefficient of permeability (K in the range of 10-6 to 10–7 m/sec). The maximum dry density of pond ash when tested as per IS: 2720 (Part 8)-1983, was found to be in the range of 11kN/m3 to 13 kN/m3 and OMC in the range of 30 to 32%.
Reinforcing material
The reinforcing geosynthetic material that was used is called friction ties (commercially known as KOLOTIES). Two type of friction ties, having ultimate tensile strength of 50 Tones (designated as KT50) and 30 Tones (designated as KT30) were used. The friction ties are composed of high tenacity polyester yarns and can undergo deformation to the extent of 10 to 12% without failure.
Tensile strength
The ultimate tensile strength and per cent elongation was tested as per ASTM D 4595. The results are shown in Table 2.
Creep resistance
Long-term creep resistance was tested according to ASTM D 5262 at elevated temperature of 62°C and at relative humidity between 50 and 70%. Creep rupture curves covering 65,700 hrs were drawn and extrapolated to 100 years of design life. For Kolotie, 73% strength retention for 100 years design life was obtained, which roughly corresponds to partial creep factor of 1.35.
Pull out test
In order to determine the friction between pond ash and friction ties, pull out test (as per Japanese Civil Engineering Society Recommen- dations) was conducted and it was found that friction resistance of pond ash-Koloties was 31°.
Chemical resistance
In order to determine the resistance of Koloties against chemical reaction, the samples of ties were immersed in the chemical solution of HCL and NaOH of different pH value and at different temperatures based on recommendation of ASTM D 543. Comparison of tensile strength before and after immersion was made. The test was conducted as per ASTM D 5322. It was concluded from the test that the reduction in tensile strength at 23°C was below 5 percent for all solutions. However, reduction rate of tensile strength at 50°C was above 20% for strong alkali solution. The decrease in the strength properties was due to hydrolysis of polyester yarns by penetration of alkali solution. It is, therefore recommended that the long-term allowable design loads shall be decided after special consideration of chemical degradation when pH value is higher than 9 in soils.
High and low temperature resistance test
Friction ties are susceptible to high and low temperature conditions of the environment. Its behaviour needs to be predicted by conducting laboratory tests. The resistance of friction ties to high and low tempe- rature conditions was tested as per ASTM D 4594 & ASTM D 5322 and ASTM D 4594 respectively. It was observed that tensile strength of Koloties reduced in the range 2.43% - 3.5% and 12.6% - 15.1% respectively.
Biological resistance test
The friction ties are used with different types of filling materials having different biological charact- eristics. The resistance to biological degradation was determined by conducting laboratory tests. It was observed that tensile strength decre- ases by about 3.0%. Therefore, biological degradation may be neglected.
Installation resistance test
Friction ties are susceptible to damage during handling and compaction of backfill material. The susceptibility to damage is tested by conducting installation resistance test as per ASTM D5818.
Partial factors
In order to design the reinforced earth wall, ultimate limit state principles as stated in BS 8006: 1995 were adopted. The ultimate limit states are associated with collapse or other similar form of structural failure. These states are attained for a specific mode of failure when disturbing forces equal or exceed restoring forces. Margins of safety, against attaining the limit state of collapse are provided by the use of partial material factors and partial load factors. Limit state design for reinforced earth employs four principal partial factors all of which assume prescribed numerical values of unity or greater. Disturbing forces are increased by multiplying by prescribed load factor to obtain design loads. Restoring forces are decreased by dividing the prescribed material factors to obtain design strengths. Two of these are load factors ff and ffc applied to dead loads, and factor fq applied to the live loads. The third principal material factor is denoted as fm and fms. The fourth factor fn accounts for the economic ramification of failure. This factor is employed in addition to material factor to produce reduced design strength. The values of various partial factors are used as per BS 8006:1995.
Internal stability
The internal stability deals with the design of reinforcement with regard to its length, cross-section against tension failure and ensuring that it has sufficient anchoring length into the backfill material. For the purpose of internal stability, the reinforcement has to be checked for tension failure and adequacy of anchoring length and stability of wedges inside the fill.
Check for tension failure
i) Rupture/long-term design strength
Td= Tult/( fmc × fm × fn)
Where fmc = material creep partial factor (1.35)
fm = fm11 × fm12 × fm21 × fm22
= 1.0 × 1.0 × 1.20 × 1.05 = 1.26
fn = 1.1
Td50 = 50 / (1.35 × 1.26 × 1.1) = 26.72 t
Td30 = 30 / (1.35 × 1.26 × 1.1) = 16.03 t
ii) Reinforcement length
The reinforcement length of the tie should be at least equal to 0.7H i.e. 0.7 x 4.6 = 3.22 m, however, from conservative consideration, a length of 4.6 m was adopted at a height of 4.6 m.
Force, Fz in a specific layer at depth Z can be calculated as
Fz = Kreq (ffs.g.Z + fq.Ws).Sv
Where,
Ws, External traffic load and Sv, Spacing between the reinforcement
Kreq = 0.32, the estimated value of Fz = 19.71 t
For Ultimate Limit State,
Fz ≤ Td i.e. 19.71 < 26.72, Hence safe
Similarly, iterations may be carried out for different lengths and heights to check the safety.
Check for adherence
Once the maximum value of T has been found, the designer should ensure all the ties/strips have an adequate anchoring length into the resisting zone to prevent pull out failure. Active and passive zones in reinforced earth portion are shown in Fig. 1.
The anchoring length Lej for the reinforcement at depth hj can be determined using the following formula
Where Pj is the total horizontal width of the top and bottom faces of the reinforcing element at the jth layer per meter run.
Tj Long-term design strength
µ Coefficient of friction between fill and reinforcing element.
ffs, ff, fp, fn Partial load factors as already explained.
abc’Adhesion coefficient between soil and reinforcement
c’ Cohesion of soil
fms Partial material factor applied to c’
Calculation for Lej
Lej can be calculated by equation
Lej = L - hjtan (45–Ø / 2)
Let us consider a height of 4.6 m, hJ – 4.6 m
Lej = 4.6 – 4.6tan (45 – 31/2) = 2.3, substituting all the values to get Pj
Pj ≥ 0.0879
But Pj = 0.09 + 0.09 = 0.18 m (Two-way friction)
Since 0.18 m > 0.0879 m
Therefore, adhesion criterion is satisfied.
Hence O.K., Similarly calculations for different heights may be carried out.
External stability
In external stability analysis, it is assumed that the Reinforced Earth Wall is an integral unit and behaves as a rigid gravity structure and conforms to the laws of applied mechanics. The external failure mechanism which was considered in the design are (a) Sliding (b) Overturning (c) Tilting/bearing failure and (d) Slip failure. Different externally applied forces on reinforced earth wall are shown in Fig. 2. The target factor of safety against sliding is 1.5, factor of safety against overturning is 2.0, factor of safety against bearing pressure is 1.0.
Check for safety against sliding
Factor of safety against sliding = Resisting force / Sliding force
Calculation of sliding force
Total design uniform surcharge/live loads(q) = 24 kN/m2
Friction coefficient µ = tan 31° = 0.6008
Reinforcement length, L = 4.6 m
Coefficient of lateral earth pressure Ka = 0.32
S1 = Sliding force due to live load = F1 x Ka , = Ka .q. H
= 0.320 × 24 × 4.6 = 35.328 kN
S2 = Sliding force due to self wt. of soil = 0.5 Ka.γ. H2
= 0.5 × 0.320 × 11 × 4.6 × 4.6 = 37.24 kN
Calculation of resisting force
W = Self weight of reinforced zone
= γ.H.L= 11 × 4.6 × 4.6 = 232.76 kN
F.Sslinding = Σ Resisting moment about toe / Σ Overturning moment about toe
(ii) Check for overturning
F.Soverturning = Σ Resisting moment about toe / Σ Overturning moment about toe
(iii) Check for bearing pressure
The typical bearing pressure imposed by a reinforced earth structure on the foundation strata, is shown in Fig.2. For design, bearing pressure is calculated as per Meyerhoff equation.
Where σv max is the factored bearing pressure acting on the base of the wall;
Rv is the resultant of all factored vertical load components (load factors as applicable to each load case)
L = Reinforcement length at the base of the wall
Where Mr and M0 are the resisting and overturning moments respectively
Vq = Surcharge load = q × L = 24 × 4.6 = 110.4 kN
W = Self weight of reinforced zone = γ.H.L= 11 × 4.6 × 4.6 = 232.76 kN
d = (535.35 - 138.35 / 232.6 ) 1.71
e = L/2 - d = 4.6/2 - 1.71 = 0.59
σv max = Rv / (L-2e)
σv max = 232.76 + 110.4 / (4.6-2×0.59) = 100.34 < 170 kN/m2Hence Safe
Similarly, calculations for different heights of backfill and length of reinforcement may be carried out.
Construction of foundation block
For the construction of foundation for facia panels, a trench of appropriate size was excavated along the proposed line. The bottom 150 mm was concreted with PCC as a leveling pad. The width, depth and reinforcement details were worked out on the basis of loads likely to come on the foundation block.
Erection of facing panels and provision of longitudinal drainage
The facing panels were lifted by a crane and placed over the foundation block from one end. The gap between facia panels and foundation beam was filled with thermocol and closed by bitumen sealant. A drainage bay 300 mm inside (inverted filter) was provided behind the panels and was filled with well-graded material of size 20mm to 0.425 mm. The facing panels were initially set at a batter of approximately 2° to 3° inside from the vertical to take care of the likely outward movement of the facing panel either due to the backfill material at the back of the wall or due to the readjustment and elongation of reinforcing material. A strip of geotextile (Fig.3) was provided at every joint not only to stop the flow of back fill material from the joints but also to ensure the flow of percolated water. Drainage of the backfill is vital for maintaining the friction between reinforcement and the pond ash. Provision made for the drainage behind the reinforced earth wall is shown in Fig.3. Panels were also temporarily supported with the help of steel struts from outside to keep them in position till the pressure is fully taken up by the reinforcing layer.
Vasant G Havanagi, Principal Scientist
Anil Kumar Sinha, Scientist and Sudhir Mathur, Chief Scientist and Head (GTE), Central Road Research Institute, New Delhi.
Introduction
Large scale infrastructural development is going on in the country under different programmes viz. National Highway Development Program (NHDP), State Road Development programmes etc. Road development activities are also going on for decongestion of urban areas in different states. In all these construction activities, to have smooth movement of traffic especially at intersections, flyovers are built along one feasible direction. The approaches of the flyovers have to be built by economical design and construction by suitable technique. Geosynthetics are relatively new road construction materials which have potential for such applications (Mandal JN ,1987, Elias, V.et.al 2001). PVC coated polyester geogrid was used for the construction of reinforced approach road of DND flyover connecting Delhi-Noida Road (Jimmy T. and Pawan T, 2008). Huabei Lie and Myoung-Soo Won (2009) advocated different parameters which have to be considered for economic design of geosynthetic reinforced soil retaining wall. Conventional earth is normally used as a backfill material. Pond ash which is a waste from thermal power plant has a potential for use as an alternative material for the backfill (Mathur etal., 2003, Yudbir and Honjo,Y.,1991, Martin,J.P, 1990, Digioia, A.M and Brendel, G.F,1998).In the present study, vertical retaining walls are built along the approaches of a flyover using geosynthetic material as reinforcement. The technique known as ‘Reinforced earth technique’ which not only saves the costly available land but also helps to decongest the intersection area. The paper discusses the utility of geosynthetics in the form of ‘friction ties’ as a reinforcement material. Pond ash was also investigated for its suitability as a backfill material instead of conventional earth.
Salient Features of Reinforced Earth Wall
To avoid decongestion at the intersection point of Kalindi Kunj road and NH-2 at Sarita Vihar, New Delhi, it was decided to construct a flyover with two carriageways each having a width of 11.25 m, with 3 lanes on each side. It was also decided that approach road of this flyover will be constructed using reinforced retaining wall. For the purpose of reinforcement, polymeric strips i.e. friction ties (commercially known as KOLOTIES) were used. The salient features of the Sarita Vihar reinforced earth wall are given in Table 1. During construction, pond ash was used as a back fill material instead of the good earth due to economic considerations.Materials Used in Reinforced Earth Wall
Pond ash was used as a backfill material instead of conventional earth as a backfill material. Geosynthetic friction ties were used as reinforcements. The properties of backfill material and reinfor- cements are briefly discussed below.Backfill
Table - 1 Salient features of Reinforced Earth Wall | |
Length of Reinforced wall | 105 m (Badarpur site)78 m (Delhi side) |
Height | 5 m (max.) |
Width | 22.5 m |
Allowable bearing capacity of subsoil | 170 kN/sq.m |
Fill Material | Pond Ash |
Reinforcement | Friction ties made of high tenacity polyester yarns (KOLOTIES) |
Facing panel | 180mm thick precast RCC panel |
Pond ash was used as a back fill material for the construction of reinforced earth retaining wall and abutment as per British Standard BS 8006-1995 ‘Code of Practice for Strengthened/Reinforced Soils and Other Fills’. Pond ash was procured from the Badarpur thermal power plant, New Delhi and was investigated for its geotechnical characteristics in the laboratory. Pond ash is a non plastic coarse grained material. The angle value for angle of internal friction varied in the range of 32°-34°. Therefore, there is a possibility of development of interfacial friction between the backfill and the reinforcement. It has high coefficient of permeability (K in the range of 10-6 to 10–7 m/sec). The maximum dry density of pond ash when tested as per IS: 2720 (Part 8)-1983, was found to be in the range of 11kN/m3 to 13 kN/m3 and OMC in the range of 30 to 32%.
Reinforcing material
The reinforcing geosynthetic material that was used is called friction ties (commercially known as KOLOTIES). Two type of friction ties, having ultimate tensile strength of 50 Tones (designated as KT50) and 30 Tones (designated as KT30) were used. The friction ties are composed of high tenacity polyester yarns and can undergo deformation to the extent of 10 to 12% without failure.
Characterisation of Reinforcing Materials
The friction ties which were used as reinforcements were tested for their tensile strength, creep resistance, pull out strength, chemical, temperature, biological and installation resistance as per ASTM standards. The brief details of the same are given below:Tensile strength
The ultimate tensile strength and per cent elongation was tested as per ASTM D 4595. The results are shown in Table 2.
Table 2 Tensile strength of friction ties | ||
Property/Type | KT30 | KT50 |
Tensile Strength (kN/m) | 35.0 | 56.6 |
Elongation (%) | 10.4 | 11.2 |
Creep resistance
Long-term creep resistance was tested according to ASTM D 5262 at elevated temperature of 62°C and at relative humidity between 50 and 70%. Creep rupture curves covering 65,700 hrs were drawn and extrapolated to 100 years of design life. For Kolotie, 73% strength retention for 100 years design life was obtained, which roughly corresponds to partial creep factor of 1.35.
Pull out test
In order to determine the friction between pond ash and friction ties, pull out test (as per Japanese Civil Engineering Society Recommen- dations) was conducted and it was found that friction resistance of pond ash-Koloties was 31°.
Chemical resistance
In order to determine the resistance of Koloties against chemical reaction, the samples of ties were immersed in the chemical solution of HCL and NaOH of different pH value and at different temperatures based on recommendation of ASTM D 543. Comparison of tensile strength before and after immersion was made. The test was conducted as per ASTM D 5322. It was concluded from the test that the reduction in tensile strength at 23°C was below 5 percent for all solutions. However, reduction rate of tensile strength at 50°C was above 20% for strong alkali solution. The decrease in the strength properties was due to hydrolysis of polyester yarns by penetration of alkali solution. It is, therefore recommended that the long-term allowable design loads shall be decided after special consideration of chemical degradation when pH value is higher than 9 in soils.
High and low temperature resistance test
Friction ties are susceptible to high and low temperature conditions of the environment. Its behaviour needs to be predicted by conducting laboratory tests. The resistance of friction ties to high and low tempe- rature conditions was tested as per ASTM D 4594 & ASTM D 5322 and ASTM D 4594 respectively. It was observed that tensile strength of Koloties reduced in the range 2.43% - 3.5% and 12.6% - 15.1% respectively.
Biological resistance test
The friction ties are used with different types of filling materials having different biological charact- eristics. The resistance to biological degradation was determined by conducting laboratory tests. It was observed that tensile strength decre- ases by about 3.0%. Therefore, biological degradation may be neglected.
Installation resistance test
Friction ties are susceptible to damage during handling and compaction of backfill material. The susceptibility to damage is tested by conducting installation resistance test as per ASTM D5818.
a) | External wall height | 1m to 4.6 m |
b) | Batter of wall face | 90° |
c) | Slope angle of soil surface | 0 |
d) | External traffic loads | 24 kN/sq.m |
e) | Type of facia | Precast RCC panels |
f) | Vertical spacing of reinforcement, Sv | 0.575 m |
g) | Width of approach | 25.50 m |
h) | Cohesion of the backfill material | 0 |
i) | Angle of internal friction of the backfill material | 31° |
j) | Unit weight of backfill | 11 kN/m2 |
k) | Bearing capacity of subsoil | 170 kN/m2 |
l) | Partial factor for pull out resistance | 1.3 |
m) | Reinforcing Material | Geosynthetic friction ties |
n) | Ultimate Tensile Strength of tie | 50 kN/m2 |
o) | Coefficient of friction between reinforcing material and fill | 0.80 |
p) | Width of reinforcing strip | 0.09 m |
Facing Panels
Facing panels of the Reinforced Earth Wall were made of panels of predetermined size. They were made of 180 mm thick precast RCC panels of M 35 grade concrete. The size of the facing panels was decided considering the weight, the total height to be covered, ease of handling and provision to provide at least one or two reinforcing elements.Design Calculations For Reinforced Earth Retaining Wall
The input parameters, which were used for the design of reinforced wall were;Partial factors
In order to design the reinforced earth wall, ultimate limit state principles as stated in BS 8006: 1995 were adopted. The ultimate limit states are associated with collapse or other similar form of structural failure. These states are attained for a specific mode of failure when disturbing forces equal or exceed restoring forces. Margins of safety, against attaining the limit state of collapse are provided by the use of partial material factors and partial load factors. Limit state design for reinforced earth employs four principal partial factors all of which assume prescribed numerical values of unity or greater. Disturbing forces are increased by multiplying by prescribed load factor to obtain design loads. Restoring forces are decreased by dividing the prescribed material factors to obtain design strengths. Two of these are load factors ff and ffc applied to dead loads, and factor fq applied to the live loads. The third principal material factor is denoted as fm and fms. The fourth factor fn accounts for the economic ramification of failure. This factor is employed in addition to material factor to produce reduced design strength. The values of various partial factors are used as per BS 8006:1995.
Symbol | Description | Value |
ffs | Partial load factor for safety | 1.50 |
fq | Partial load factor for traffic loading | 1.30 |
fm | Partial material factor | 1.20 |
fms | Partial material factor fm11 x fm12 x fm21 x fm22 |
|
Where, fm11 = A factor to cover the possible reductions in the capacity of the materials as a whole compared with the characteristics value derived from the control test. |
1.0 | |
fm12 = Extrapolation of test data to take account of the confidence of the long term capacity assessment. |
1.0 | |
fm21 = Susceptibility to damage to take account of damage during construction. | 1.2 | |
fm22 = Environment factor to take account of different rates of degradation | 1.05 | |
fn = Economic ramification factor | 1.10 | |
fmc = Material creep partial factor | 1.35 | |
Reinforced Earth Wall was designed considering the external and internal stability which have been explained below: |
Internal stability
The internal stability deals with the design of reinforcement with regard to its length, cross-section against tension failure and ensuring that it has sufficient anchoring length into the backfill material. For the purpose of internal stability, the reinforcement has to be checked for tension failure and adequacy of anchoring length and stability of wedges inside the fill.
Check for tension failure
i) Rupture/long-term design strength
Td= Tult/( fmc × fm × fn)
Where fmc = material creep partial factor (1.35)
fm = fm11 × fm12 × fm21 × fm22
= 1.0 × 1.0 × 1.20 × 1.05 = 1.26
fn = 1.1
Td50 = 50 / (1.35 × 1.26 × 1.1) = 26.72 t
Td30 = 30 / (1.35 × 1.26 × 1.1) = 16.03 t
ii) Reinforcement length
The reinforcement length of the tie should be at least equal to 0.7H i.e. 0.7 x 4.6 = 3.22 m, however, from conservative consideration, a length of 4.6 m was adopted at a height of 4.6 m.
Force, Fz in a specific layer at depth Z can be calculated as
Fz = Kreq (ffs.g.Z + fq.Ws).Sv
Where,
Ws, External traffic load and Sv, Spacing between the reinforcement
Kreq = 0.32, the estimated value of Fz = 19.71 t
For Ultimate Limit State,
Fz ≤ Td i.e. 19.71 < 26.72, Hence safe
Similarly, iterations may be carried out for different lengths and heights to check the safety.
Check for adherence
Once the maximum value of T has been found, the designer should ensure all the ties/strips have an adequate anchoring length into the resisting zone to prevent pull out failure. Active and passive zones in reinforced earth portion are shown in Fig. 1.
The anchoring length Lej for the reinforcement at depth hj can be determined using the following formula
Where Pj is the total horizontal width of the top and bottom faces of the reinforcing element at the jth layer per meter run.
Tj Long-term design strength
µ Coefficient of friction between fill and reinforcing element.
ffs, ff, fp, fn Partial load factors as already explained.
abc’Adhesion coefficient between soil and reinforcement
c’ Cohesion of soil
fms Partial material factor applied to c’
Calculation for Lej
Lej can be calculated by equation
Lej = L - hjtan (45–Ø / 2)
Let us consider a height of 4.6 m, hJ – 4.6 m
Lej = 4.6 – 4.6tan (45 – 31/2) = 2.3, substituting all the values to get Pj
Pj ≥ 0.0879
But Pj = 0.09 + 0.09 = 0.18 m (Two-way friction)
Since 0.18 m > 0.0879 m
Therefore, adhesion criterion is satisfied.
Hence O.K., Similarly calculations for different heights may be carried out.
External stability
In external stability analysis, it is assumed that the Reinforced Earth Wall is an integral unit and behaves as a rigid gravity structure and conforms to the laws of applied mechanics. The external failure mechanism which was considered in the design are (a) Sliding (b) Overturning (c) Tilting/bearing failure and (d) Slip failure. Different externally applied forces on reinforced earth wall are shown in Fig. 2. The target factor of safety against sliding is 1.5, factor of safety against overturning is 2.0, factor of safety against bearing pressure is 1.0.
Check for safety against sliding
Factor of safety against sliding = Resisting force / Sliding force
Calculation of sliding force
Total design uniform surcharge/live loads(q) = 24 kN/m2
Friction coefficient µ = tan 31° = 0.6008
Reinforcement length, L = 4.6 m
Coefficient of lateral earth pressure Ka = 0.32
S1 = Sliding force due to live load = F1 x Ka , = Ka .q. H
= 0.320 × 24 × 4.6 = 35.328 kN
S2 = Sliding force due to self wt. of soil = 0.5 Ka.γ. H2
= 0.5 × 0.320 × 11 × 4.6 × 4.6 = 37.24 kN
![]() |
![]() |
Figure 1: Determination of adherence capacity of reinforcement | Figure 2: Externally applied forces on reinforced earth wall |
Calculation of resisting force
W = Self weight of reinforced zone
= γ.H.L= 11 × 4.6 × 4.6 = 232.76 kN
F.Sslinding = Σ Resisting moment about toe / Σ Overturning moment about toe
(ii) Check for overturning
F.Soverturning = Σ Resisting moment about toe / Σ Overturning moment about toe
(iii) Check for bearing pressure
The typical bearing pressure imposed by a reinforced earth structure on the foundation strata, is shown in Fig.2. For design, bearing pressure is calculated as per Meyerhoff equation.
Where σv max is the factored bearing pressure acting on the base of the wall;
Rv is the resultant of all factored vertical load components (load factors as applicable to each load case)
L = Reinforcement length at the base of the wall
Where Mr and M0 are the resisting and overturning moments respectively
Vq = Surcharge load = q × L = 24 × 4.6 = 110.4 kN
W = Self weight of reinforced zone = γ.H.L= 11 × 4.6 × 4.6 = 232.76 kN
d = (535.35 - 138.35 / 232.6 ) 1.71
e = L/2 - d = 4.6/2 - 1.71 = 0.59
σv max = Rv / (L-2e)
σv max = 232.76 + 110.4 / (4.6-2×0.59) = 100.34 < 170 kN/m2Hence Safe
Similarly, calculations for different heights of backfill and length of reinforcement may be carried out.
Construction Methodology of Reinforced Earth Wall
The construction methodology adopted for reinforced earth wall construction has been briefly explained here.Construction of foundation block
![]() |
Figure 3(a): Provision of geotextiles in the space between the facing panels (b) longitudinal drainage |
For the construction of foundation for facia panels, a trench of appropriate size was excavated along the proposed line. The bottom 150 mm was concreted with PCC as a leveling pad. The width, depth and reinforcement details were worked out on the basis of loads likely to come on the foundation block.
Erection of facing panels and provision of longitudinal drainage
The facing panels were lifted by a crane and placed over the foundation block from one end. The gap between facia panels and foundation beam was filled with thermocol and closed by bitumen sealant. A drainage bay 300 mm inside (inverted filter) was provided behind the panels and was filled with well-graded material of size 20mm to 0.425 mm. The facing panels were initially set at a batter of approximately 2° to 3° inside from the vertical to take care of the likely outward movement of the facing panel either due to the backfill material at the back of the wall or due to the readjustment and elongation of reinforcing material. A strip of geotextile (Fig.3) was provided at every joint not only to stop the flow of back fill material from the joints but also to ensure the flow of percolated water. Drainage of the backfill is vital for maintaining the friction between reinforcement and the pond ash. Provision made for the drainage behind the reinforced earth wall is shown in Fig.3. Panels were also temporarily supported with the help of steel struts from outside to keep them in position till the pressure is fully taken up by the reinforcing layer.
Laying and compaction of backfill
The fill material (pond ash) was brought by trucks and unloaded at site. The ash was spread over the entire width of the approach embankment with the help of the dozer and tractor and then compacted using vibratory and static rollers as shown in the Fig. 4. However near the facing panel i.e. over a width of 1.5 m the pond ash was compacted using plate compactors (Fig.4). This was done to avoid heavy lateral pressures which may come on the facing panels and may result in the outward movement of the wall. Pond ash was compacted in layers of 100 mm thickness near the facing panel, however in the remaining area, compacted thickness was kept around 200 mm. The moisture content of pond ash laid for compaction varied from 25% to 30% and density achieved was in the range of 10 kN/m3 to 13 kN/m3.![]() |
Figure 4: Compaction of Backfill (pond ash) with vibratory roller and plate vibrator |
Laying of reinforcing material (Koloties)
Before the laying of Koloties, fill and filter material were compacted in layers to the level of the first layer of the frictional anchor. Koloties were then placed to the alignment as per the drawings in horizontal layers. It was looped between panel anchors and the outer fixing bar. In case of joints, at least 1 to 1.5 m overlap was provided. After laying Koloties were hand tightened to remove any slackness before placing the next layer of filler material (Pond ash). This sequence was repeated till desired height was reached. Top panels were covered by cast in-situ capping beam. Layers of friction ties are shown in Fig.5.![]() |
Figure 5: Laying of friction ties |
Construction of pavement crust
After the reinforced fill was constructed, a mixture of Yamuna sand and pond ash was laid above it for a depth of about 50 cm. This was done to improve the stability of the reinforced portion. Over this layer sub grade soil was laid compacted as per MORTH specifications. The pavement crust consisted of 300 mm thick granular sub-base, 250mm Wet Mix Macadam (WMM), 50mm Bitumin- ous Macadam (BM), 50mm Dense Bituminous Macadam (DBM) follo- wed by 40mm Bituminous concrete (BC). The construction of capping beam and crash barrier was done.Conclusions
- This reinforced earth technique is particularly advantageous in urban areas where land is scarce and land values are high. Reinforced earth enables construction of walls on the boundary of the area available without encroaching upon the adjacent land.
- The technique is simple and easy to install. There are only three components i.e. facing panels, frictional anchors and soil/pond ash. With slight experience, construction can be carried out with a very fast pace of construction.
- Pond ash could be used as an alternative to conventional earth as a backfill material.
- Since there is very little transfer of load to the ground and system being flexible in nature, it can be used on soils with low bearing capacity.
- The distinctive pre-formed facing units can be manufactured with a variety of attractive pattern and in different colours. This helps in improving aesthetics of the structure blending with the surrounding.
- This type of wall being flexible is safer in earthquake prone areas as compared to conventional reinforced concrete retaining wall.
Acknowledgement
The paper is published with the kind permission of Director, CRRI. The authors acknowledge Sh.U.K.Guruvittal and Sh.Alok Ranjan, scientists of the division for their contribution during quality supervision of construction of flyover.References
- Digioia, A.M and Brendel, G.F,(1998) “Coal ash as structural fill”, International Conference - Pond ash Disposal & Utilisation, Organised by CBIP, New Delhi, Vol II, pp. 39-48.
- Elias, V., Christopher, B. R., and Berg, R. R. (2001). “Mechanically stabilized earth walls and reinforced soil slopes—Design and construction guidelines.” Rep. No. FHWA-NHI-00-043, Federal Highway Administration (FHwA), Washington, D.C.
- Huabei Lie amd Myoung-Soo Won(2009) “Long-term reinforce- ment load of geosynthetic –reinforced soil retaining walls” Journal of geotechnical and geo- environmental engg. Vol. 135 (7).
- Jimmy Thomas and Pawan Tripthi (2008) “Geogrid reinforced soil walls with welded wire mesh facing to retain the approaches to a flyover.” International seminar on geosynthetics, Hyderabad, India. Published by international geosynthetics society and Central board of irrigation and power, New Delhi.
- Mandal JN (1987). “Geotextiles in India” Journal of Geotextiles and Geomembrane, Vol. 6(4) pp 235-274.
- Martin,J.P., Collins, R.A., Browning, S.J and Biehl, F.J., (1990) “Properties and Use of Pond Ashes for Embankments”, Journal of ASCE Energy Engineering, Vol. 116, No.2, pp. 71-86.
- Mathur, S., Guruvittal, U.K., Havanagi, V. G., and Sinha, A.K, (2003). “Design and construction of reinforced approach embank- ment using pond ash”. Proceeding of 3rd International Conference – Fly ash Utilisation & Disposal, New Delhi, Vol. 1, pp VI 39- VI 45.
- Yudbir and Honjo,Y.,(1991) “Applications of Geotechnical Engineering to Environmental Control,” Theme Lecture at 9th Asian Regional Conference on Soil Mechanics and Foundation Engineering, Bangkok,pp.431-469.